Nordic outdoor apparel retailer, €38M online revenue, 156 weeks of data, the CFO asked what last year would have been without marketing.
A composite case, built from the kind of file we see most weeks. An outdoor apparel retailer selling online in Sweden, Norway and Finland, €38.0M of revenue in 2025 and €3.1M of marketing behind it.
The question came from the CFO, and it came in exactly the form a CFO asks it: "If we had spent nothing on marketing last year, what would revenue have been? I am being asked to protect margin and I want to know what I would be cutting."
Behind the question was a proposal already on the table: a 40% cut to marketing, about €1.24M, on the theory that the brand was strong enough to carry itself.
What the file looked like
156 weekly rows, 2023 to 2025. Revenue, spend by channel (paid search, paid social, display, email and a printed catalogue twice a year), average discount depth, and weather for the main markets.
Two features made the file better than most. Spend had varied a lot, between about €20,000 and €140,000 a week. And there had been two accidental dark spells: five weeks in spring 2024 when the paid social account was suspended, and a summer when paid search was cut to almost nothing. Weeks close to zero are what make a zero-marketing estimate something more than an extrapolation.
How the counterfactual year is built
Base vs Incremental sits at the end of the Discovery Path, and it uses everything before it. The trend held fixed from the first step, the seasonal profile from the second, and the contribution of every driver from the decomposition, the step that in an earlier case gave a summer spike back to price and heat.
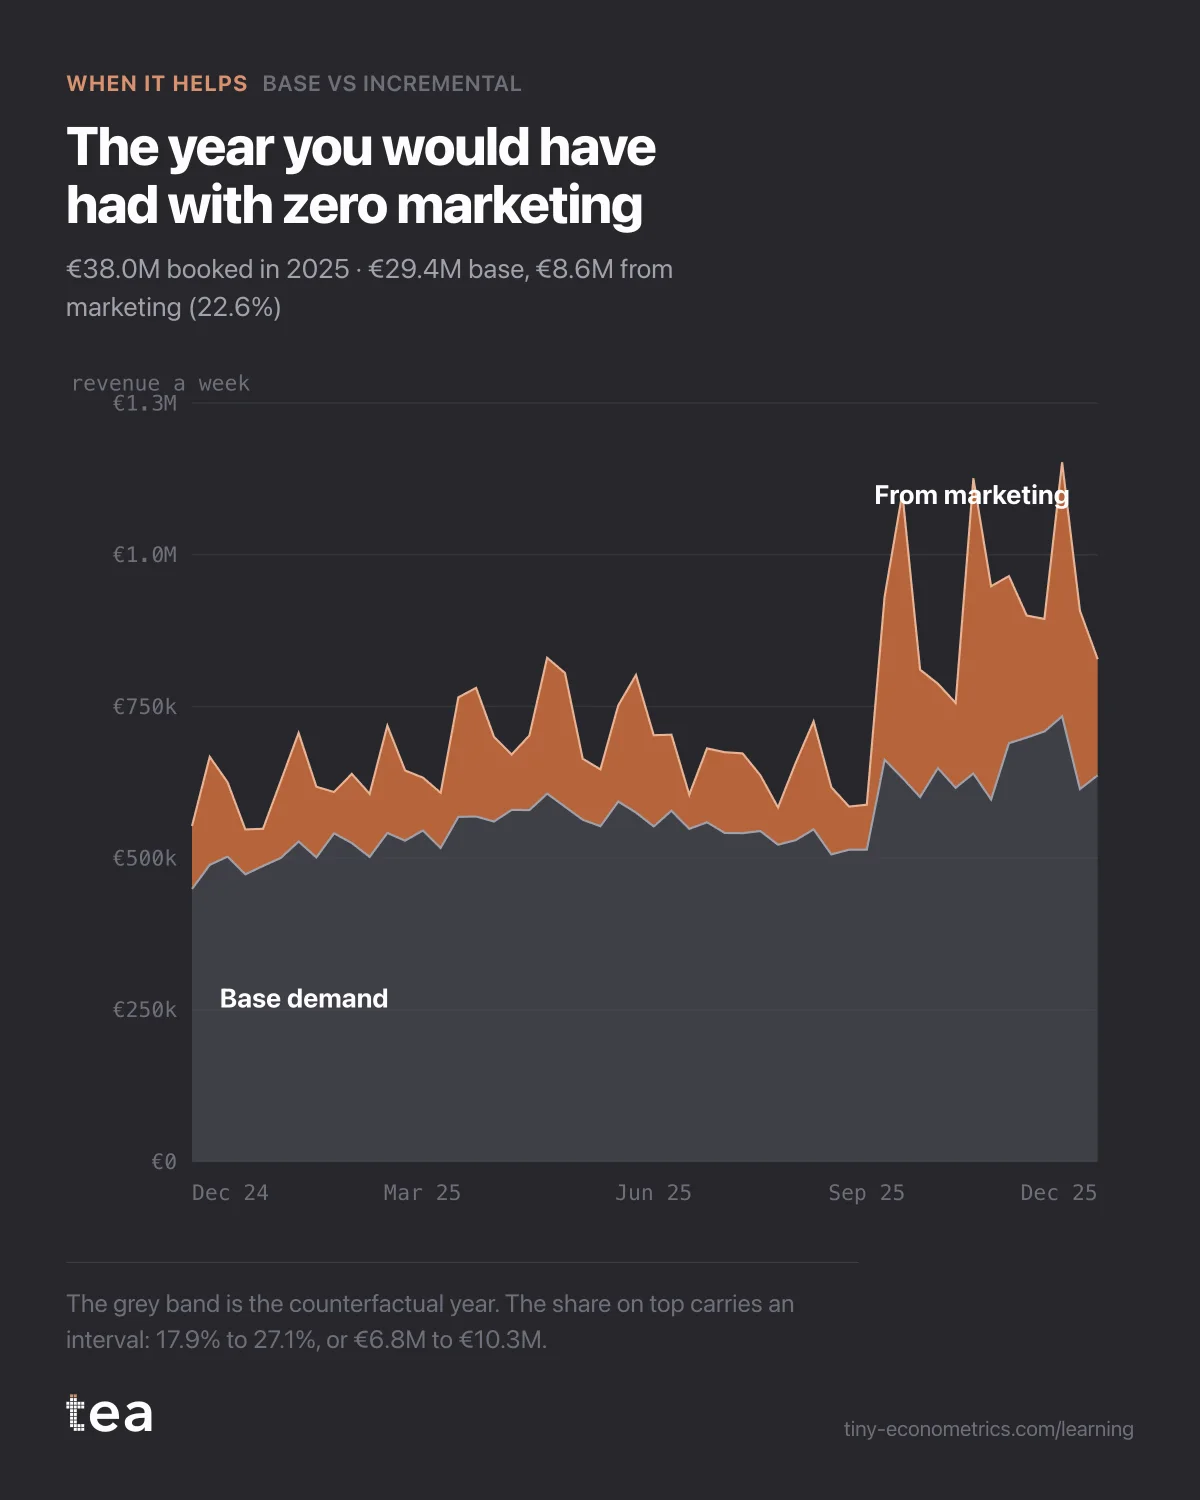
Then the question is answered literally. Every marketing variable in the fitted model is set to zero, for every week of 2025, including the carryover that adstock would have brought from December 2024 into January. The model recomputes each week. What comes out is the counterfactual year: the revenue the business would have booked with the same prices, the same weather and the same calendar, and no marketing at all.
The difference between the year that happened and that one is the incremental revenue. Because the model's coefficients carry uncertainty, the difference does too, and the interval comes with it.
The answer, with its interval
Of €38.0M booked in 2025, €29.4M is base and €8.6M came from marketing. That is 22.6% of the year, with a 95% interval from 17.9% to 27.1%, or €6.8M to €10.3M.
Per euro of marketing, €2.77 of revenue, with an interval from €2.19 to €3.32. At the retailer's gross margin of 52%, the €8.6M is about €4.5M of margin on €3.1M of spend. Even at the bottom of the interval, €3.5M of margin.
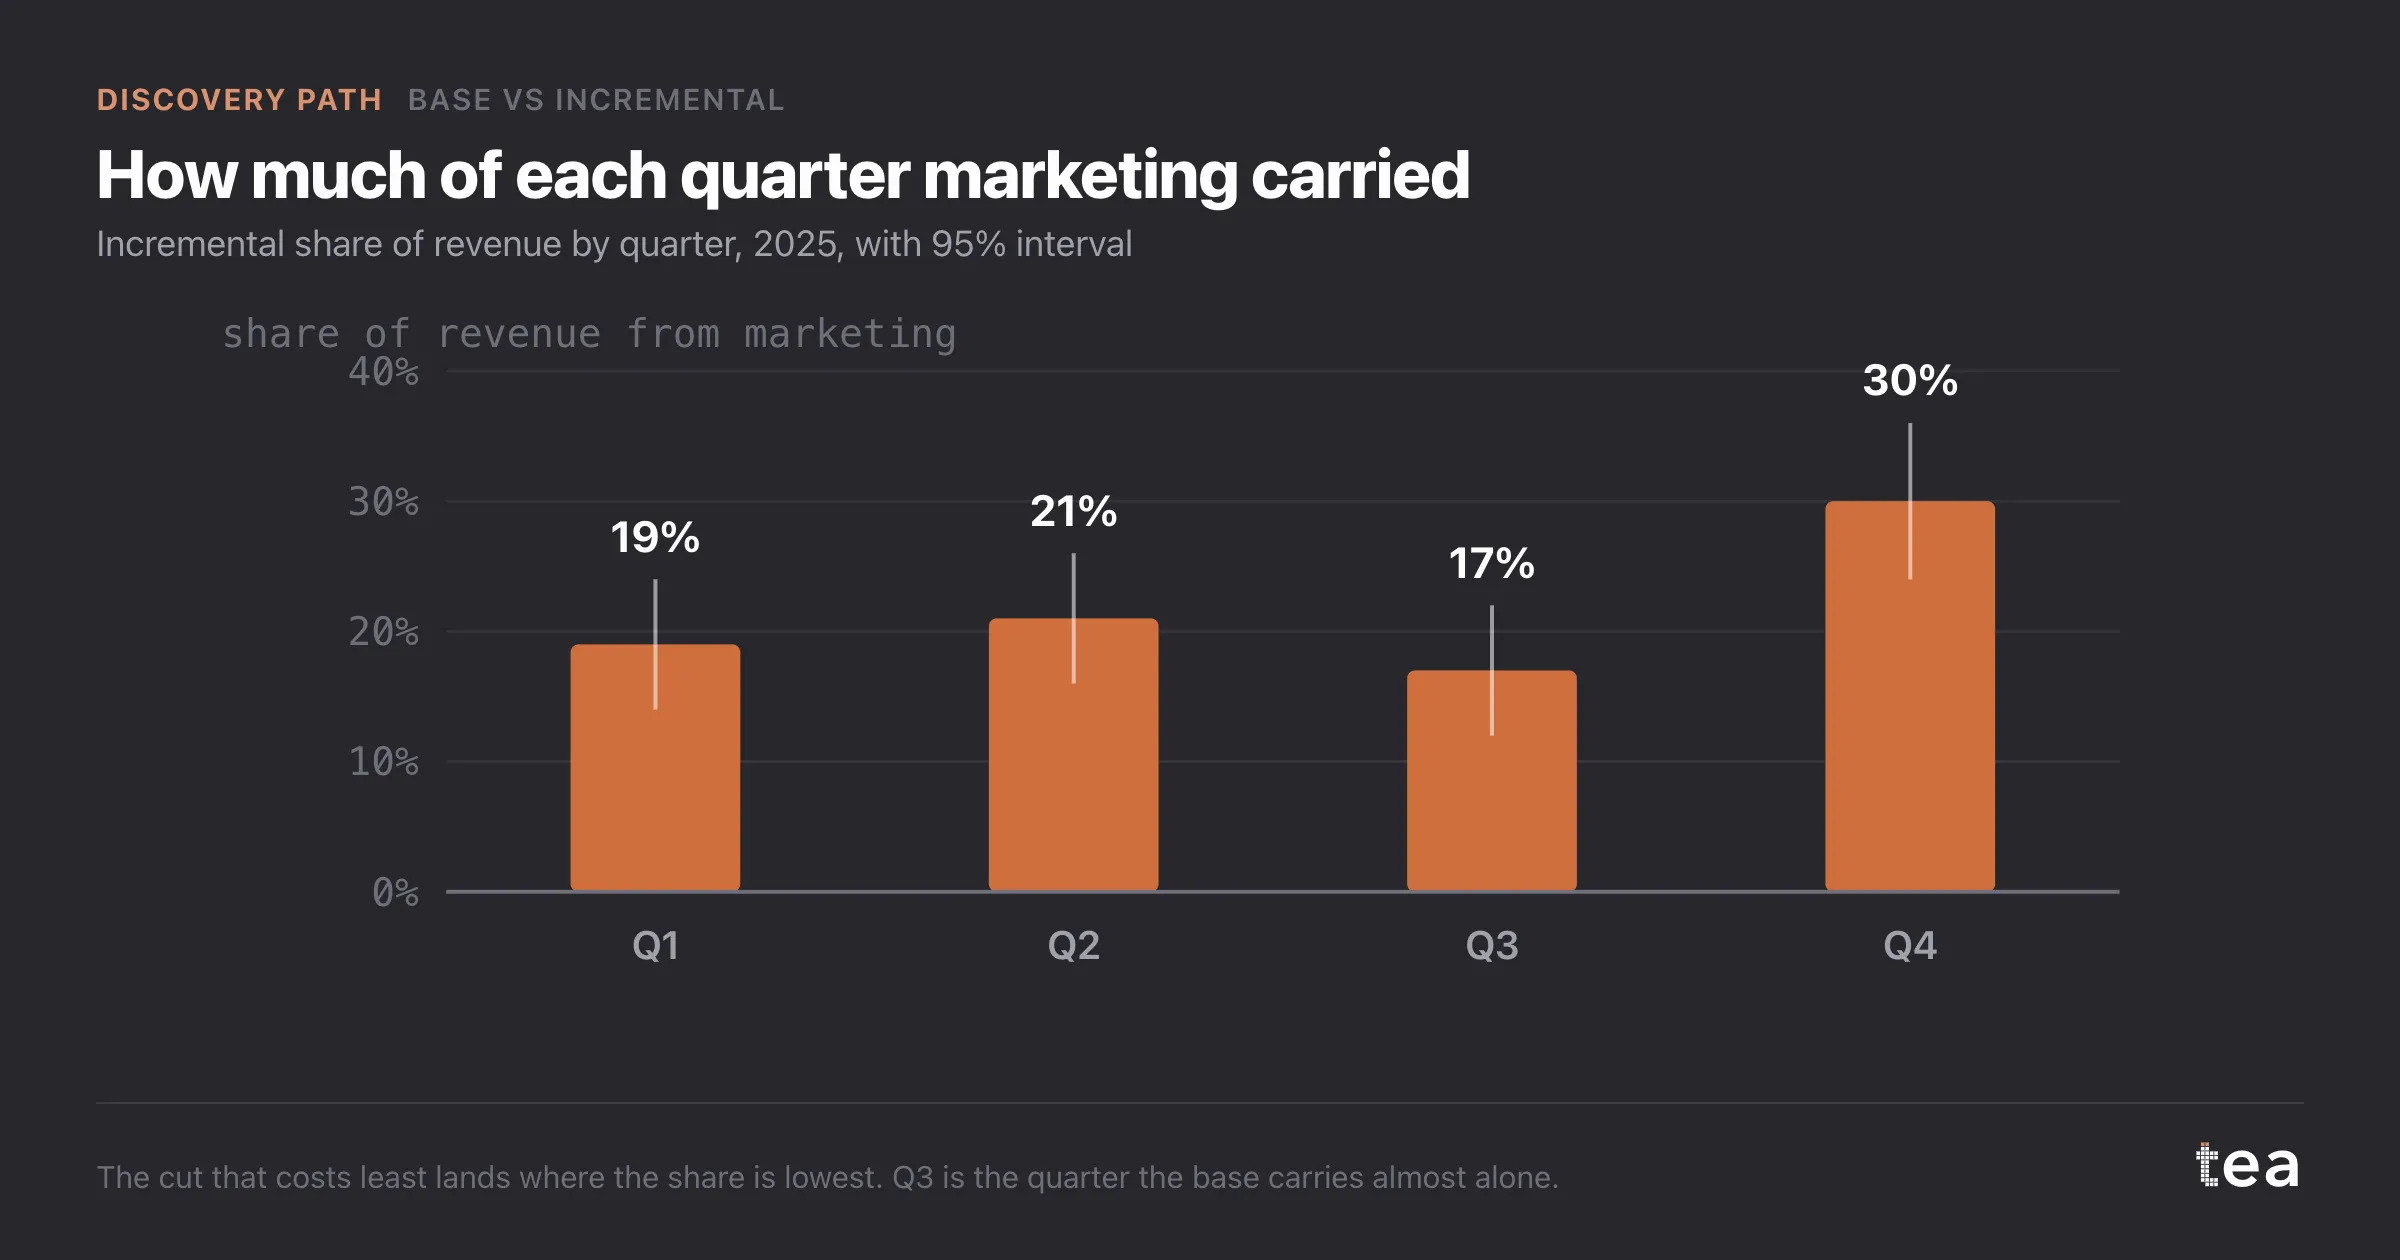
The quarters were not equal. Marketing carried 19% of Q1, 21% of Q2, 17% of Q3 and 30% of Q4, when the autumn and winter collections launch and the catalogue lands. Q3, the summer, was the quarter the base carried almost alone.
The decision it changed
The 40% cut assumed that most of the €38M was base, and it was right about that: three quarters of the year would have arrived anyway. It was wrong about what the last quarter was worth. Removing €1.24M of spend at the average rate would have taken about €3.4M of revenue with it.
The cut became 12%, about €370,000, almost all of it taken from Q3, where the incremental share was lowest.
One limit was stated in the memo, because it decides how the 12% should be read. A counterfactual answers the CFO's question about the year: what marketing as a whole added. It does not say what the last euro in each channel bought. Average returns and marginal returns are different numbers, and the second comes from Saturation Curves. The cut was made in the quarter where average returns were lowest; the next step was checking that the channels being cut were also past their bend.
The lesson
"What if we had spent nothing" is a fair question with a real answer, as long as the file contains weeks that came close to nothing and the answer arrives with its interval. Ask for the counterfactual year, not just the share, and look at where in the year marketing does its work.
tea, the product
Your file, this question
Fifteen analyses on a CSV of weekly data, with the intervals and the diagnostics shown, and a plain sentence when the data cannot answer. Free while in beta, by invitation.
Request a place in the beta→tea, the product
Fifteen econometric analyses on your own CSV: Base vs Incremental, saturation curves, elasticities, budget allocation. Intervals and diagnostics shown, and a plain sentence when the file cannot answer.
Free while in beta, by invitation.
Request a place in the beta →Liked this? Run it on your own data.
tea runs Base vs Incremental and fourteen other analyses on any weekly CSV, in minutes. Free while in beta, by invitation.
The Discovery Story
- Trend analysis with a structural break, and why one line lies
- Subscription growth from marketing, or a slope already there
- Easter, year-on-year comparisons and the quarter that did not fall
- When TV and branded search collinearity defeats the regression
- A sales spike credited to influencers, decomposed by driver
- What would revenue be with zero marketing? The counterfactual year
- Base vs incremental after a launch, with no base in the data (out October 27, 2026)