UK premium crisps brand, 78 weeks of retail units, asked whether next year can be planned on its growth rate.
A composite case, built from the kind of file we see most weeks. A premium crisps brand in the UK, about £2.5M a year at retail, with a small commercial team and a forecast due for the annual plan.
The question came in one line: "We have grown about 175 units a week, every week, for eighteen months. Can we plan next year on that?"
It is the right first question. The Discovery Path starts with the structural slope precisely so that nothing downstream gets credit for it. This time the slope was the problem.
What the file looked like
78 weekly rows, April 2024 to September 2025. One column of units sold through retail, one of average shelf price, one of media spend that was zero most weeks. No store count. No rate of sale. Nothing that described where the product was on shelf.
That last absence mattered, because in week 41, the first week of January 2025, the brand was listed by a national grocer. Stores went from roughly 600 to roughly 1,400 in a fortnight. Everyone on the team knew this. The file did not.
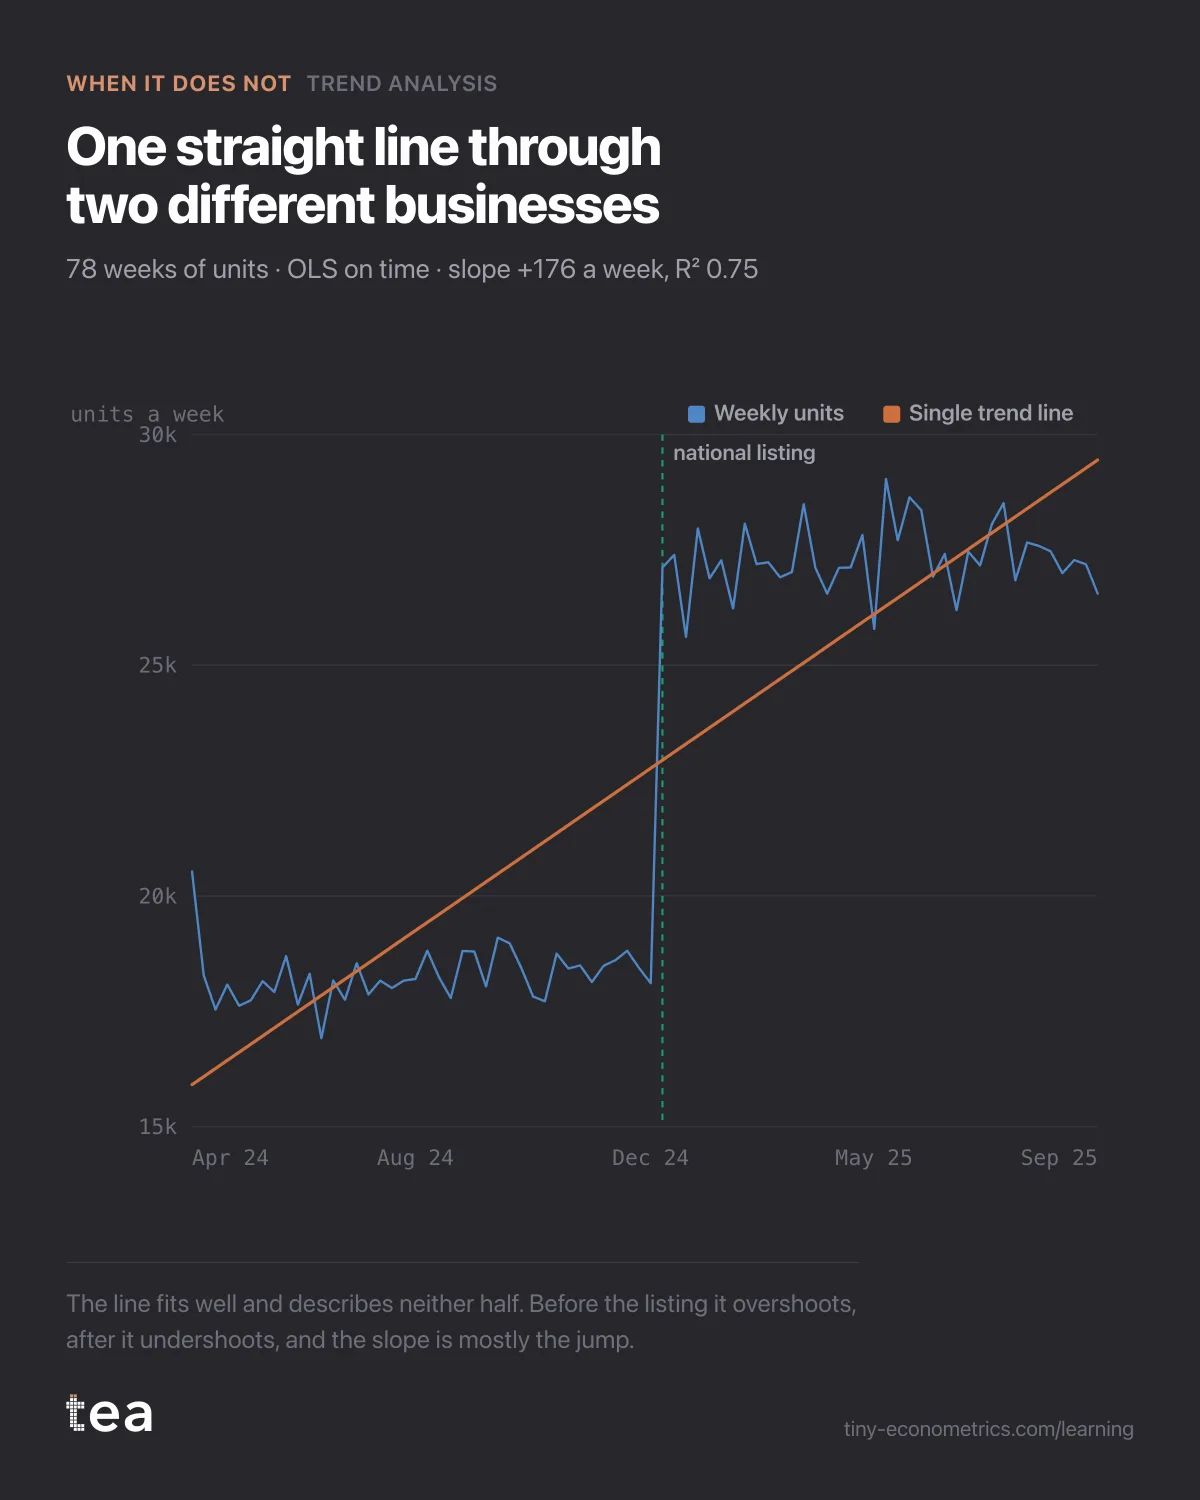
On a chart the series looks like a staircase with one step. Before the listing, units sit around 18,300 a week. After it, around 27,300. Inside each half the line is close to flat.
What one straight line does to a staircase
Trend Analysis fits ordinary least squares on time: one intercept, one slope, one line. On this file the slope came out at +176 units a week, with an R² of 0.75. Taken on its own, that is a respectable fit and a very confident slope.
It is also a description of neither half of the business.
A straight line forced through a step has to tilt to reach both levels. It starts above the early weeks, runs below the weeks just before the listing, jumps above them again just after, and ends below the most recent weeks. The residuals are not noise around zero. They are a pattern, and the pattern is the step the model was not told about.
The diagnostics say so in their own language. The Durbin-Watson statistic on the residuals is 0.37, where something near 2 would mean the errors are independent. Long runs of residuals with the same sign are the signature of a missing variable, and here the missing variable is a listing.
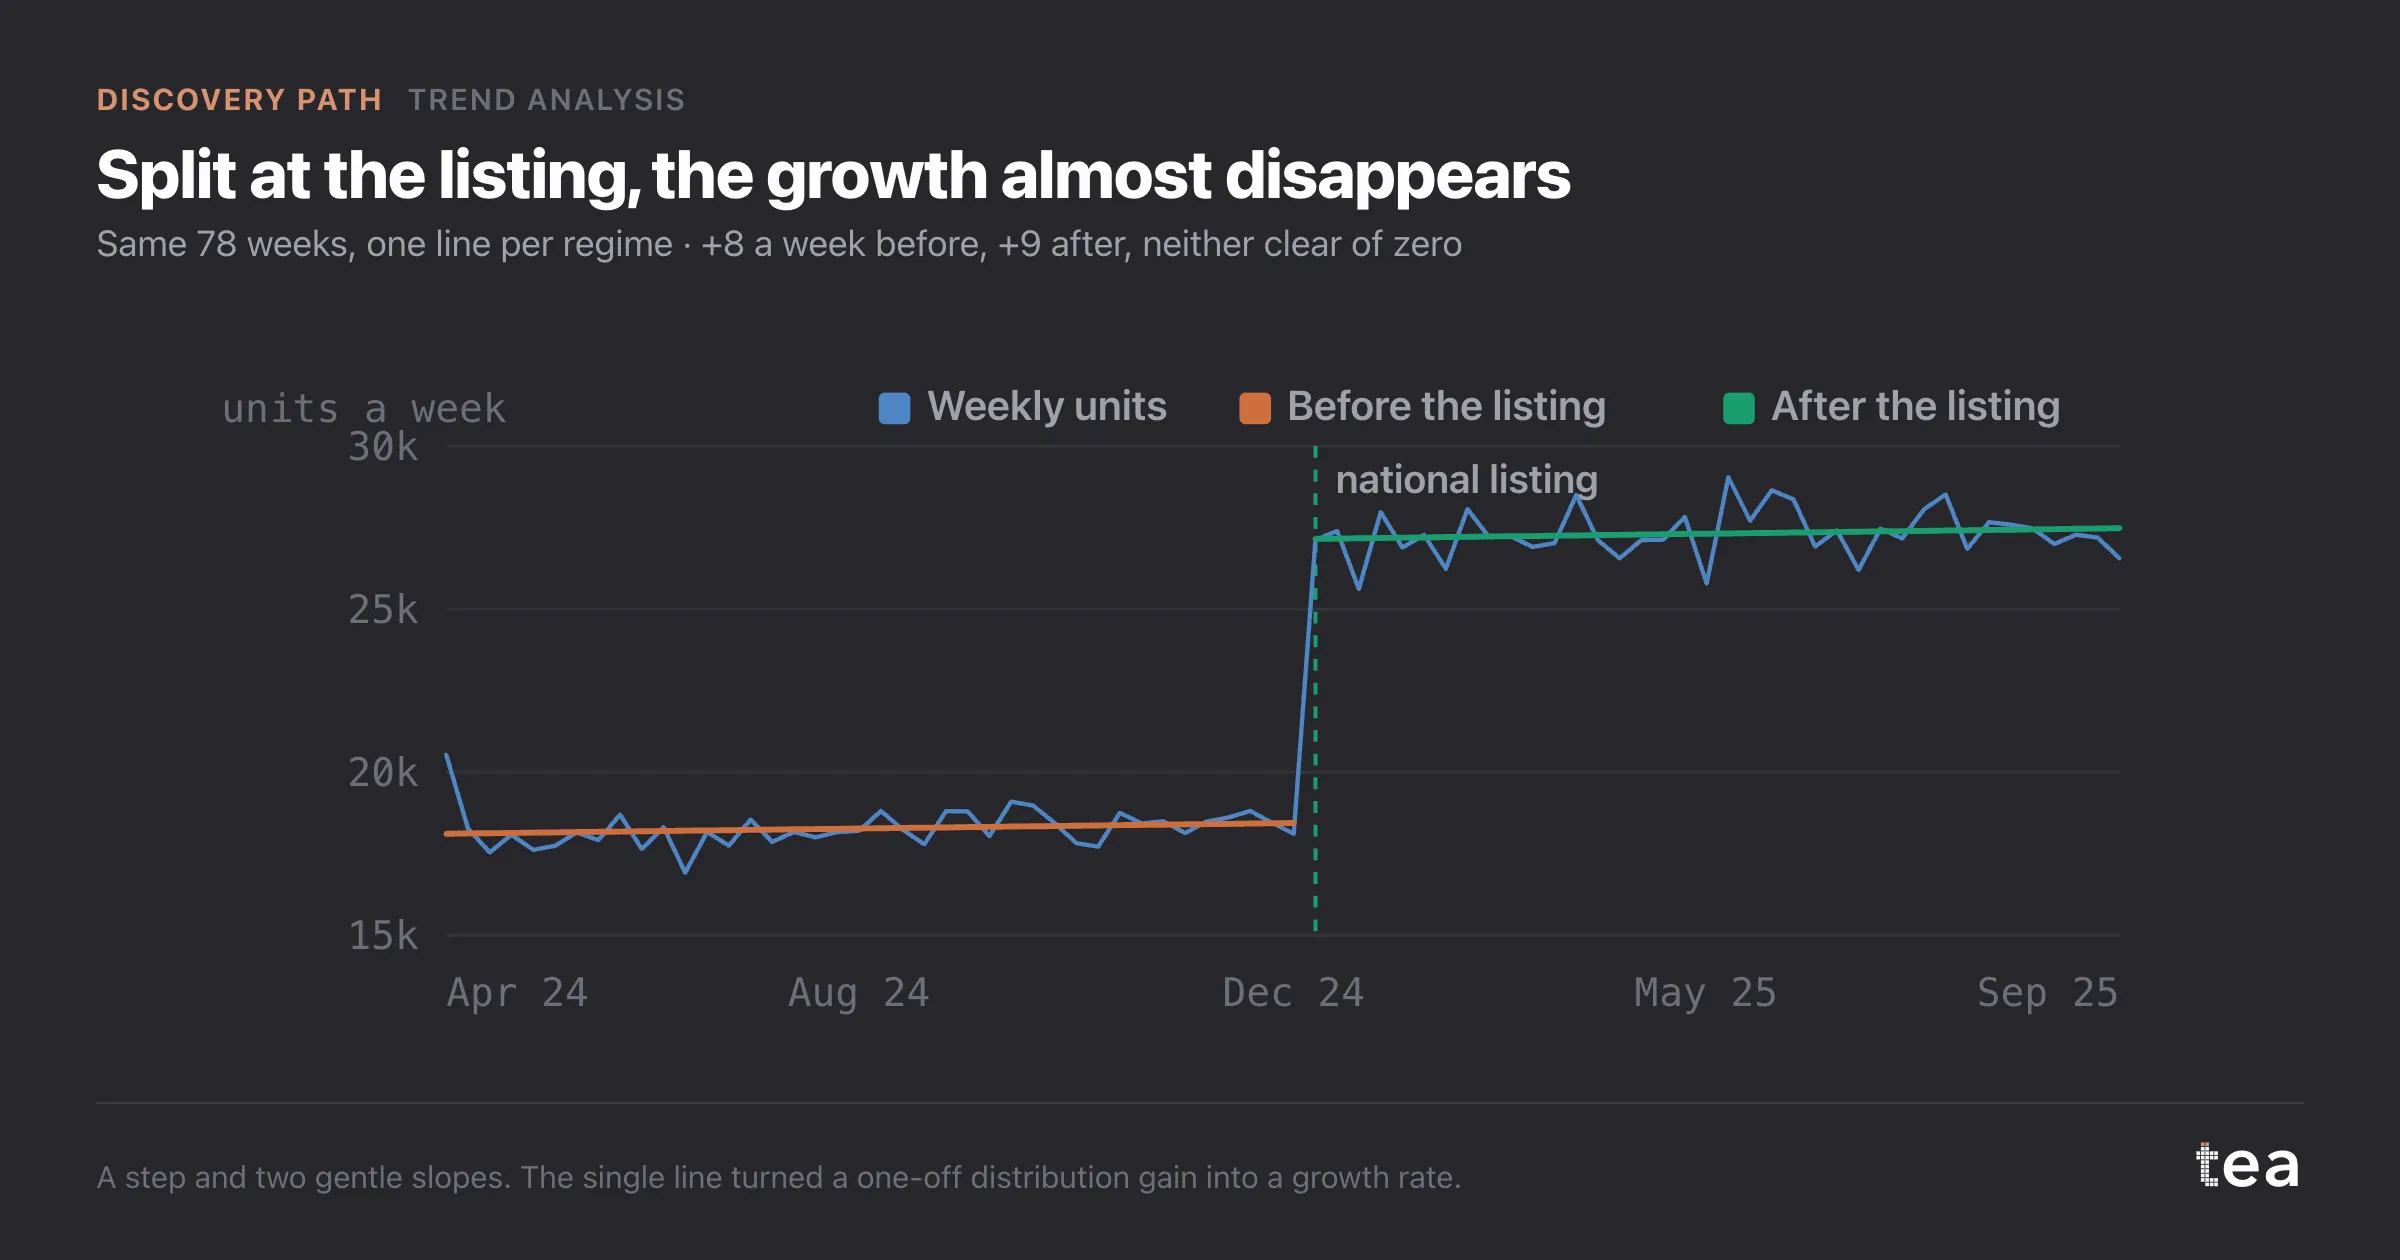
Split the series at week 41 and fit each half on its own, and the growth almost disappears:
- before the listing, +8 units a week, with a 95% interval from about -8 to +24;
- after the listing, +9 units a week, with an interval from about -13 to +31.
Neither slope can be told apart from zero. The +176 was never a growth rate. It was a one-off gain of about 9,000 units a week, roughly 49%, spread across 78 weeks by a model that only knows how to draw lines.
What would have gone wrong
Extend the single line twelve months and it projects about 38,600 units a week by next September. The post-listing half, extended the same way, projects about 27,900. The plan would have been built 38% above where the business is actually heading.
That gap does not stay on a spreadsheet. It becomes a production order, a sales target and a trade budget. When next year lands at 28,000 a week, somebody will go looking for a cause, and the first suspect will be whatever marketing ran that year. A modelling shortcut turns into a performance review.
What to do instead
The trend is the wrong tool for this file as it stands, and a different setting of the same tool would not fix it. Three things would.
Split. Plan on the post-listing regime only. It is 38 weeks long, which is thin, and the interval on its slope is honest about that. A flat plan with a wide band is a better plan than a steep one with a false band.
Model the break. Add the break to the file. A step dummy that switches on in week 41 lets a regression estimate the jump and the slope separately. Better still, add the store count and model units per store: a listing then becomes distribution, which is what it is, and the slope becomes rate of sale, which is what the team actually wants to grow.
Wait. Whether +9 a week is real growth or noise will be readable with another six months of post-listing data. Until then the honest forecast is "about where we are, plus whatever the next listing brings", and that sentence belongs in the plan as written.
The lesson
A trend line assumes the business was one business for the whole window. Before you read a slope, ask what changed in distribution, pricing or range during the period, and put it in the file. If you cannot, cut the window at the change.
The Discovery Path
- Trend analysis with a structural break, and why one line lies
- Subscription growth from marketing, or a slope already there
- Easter, year-on-year comparisons and the quarter that did not fall (out October 7, 2026)
- When TV and branded search collinearity defeats the regression (out October 12, 2026)
- A sales spike credited to influencers, decomposed by driver (out October 17, 2026)
- What would revenue be with zero marketing? The counterfactual year (out October 22, 2026)
- Base vs incremental after a launch, with no base in the data (out October 27, 2026)