Coffee subscription business in the Netherlands and Belgium, 36 months of active subscribers, asked whether doubling campaign spend doubles growth.
A composite case, built from the kind of file we see most weeks. A coffee subscription business selling in the Netherlands and Belgium, around 31,000 active subscribers, a monthly box, and a first year of paid campaigns behind it.
The head of growth wrote: "Since July the campaigns have brought in about 4,000 new subscribers. If we double the budget, do we get 8,000?"
The arithmetic in the question is the problem. It assumes every subscriber gained since July was gained by the campaigns.
What the file looked like
36 monthly rows, July 2023 to June 2026, with one number: active subscribers at month end. Campaigns, podcast sponsorships and paid social, ran from July 2025 at about €38,000 a month. Before that there was no paid media at all.
What was missing: gross new subscribers and cancellations were not separated, so the series is net growth. There was no spend column for the first 24 months because there was no spend.
That last fact is what made the file useful. Two clean years before any campaign is the best gift a growth question can bring.
What the trend did
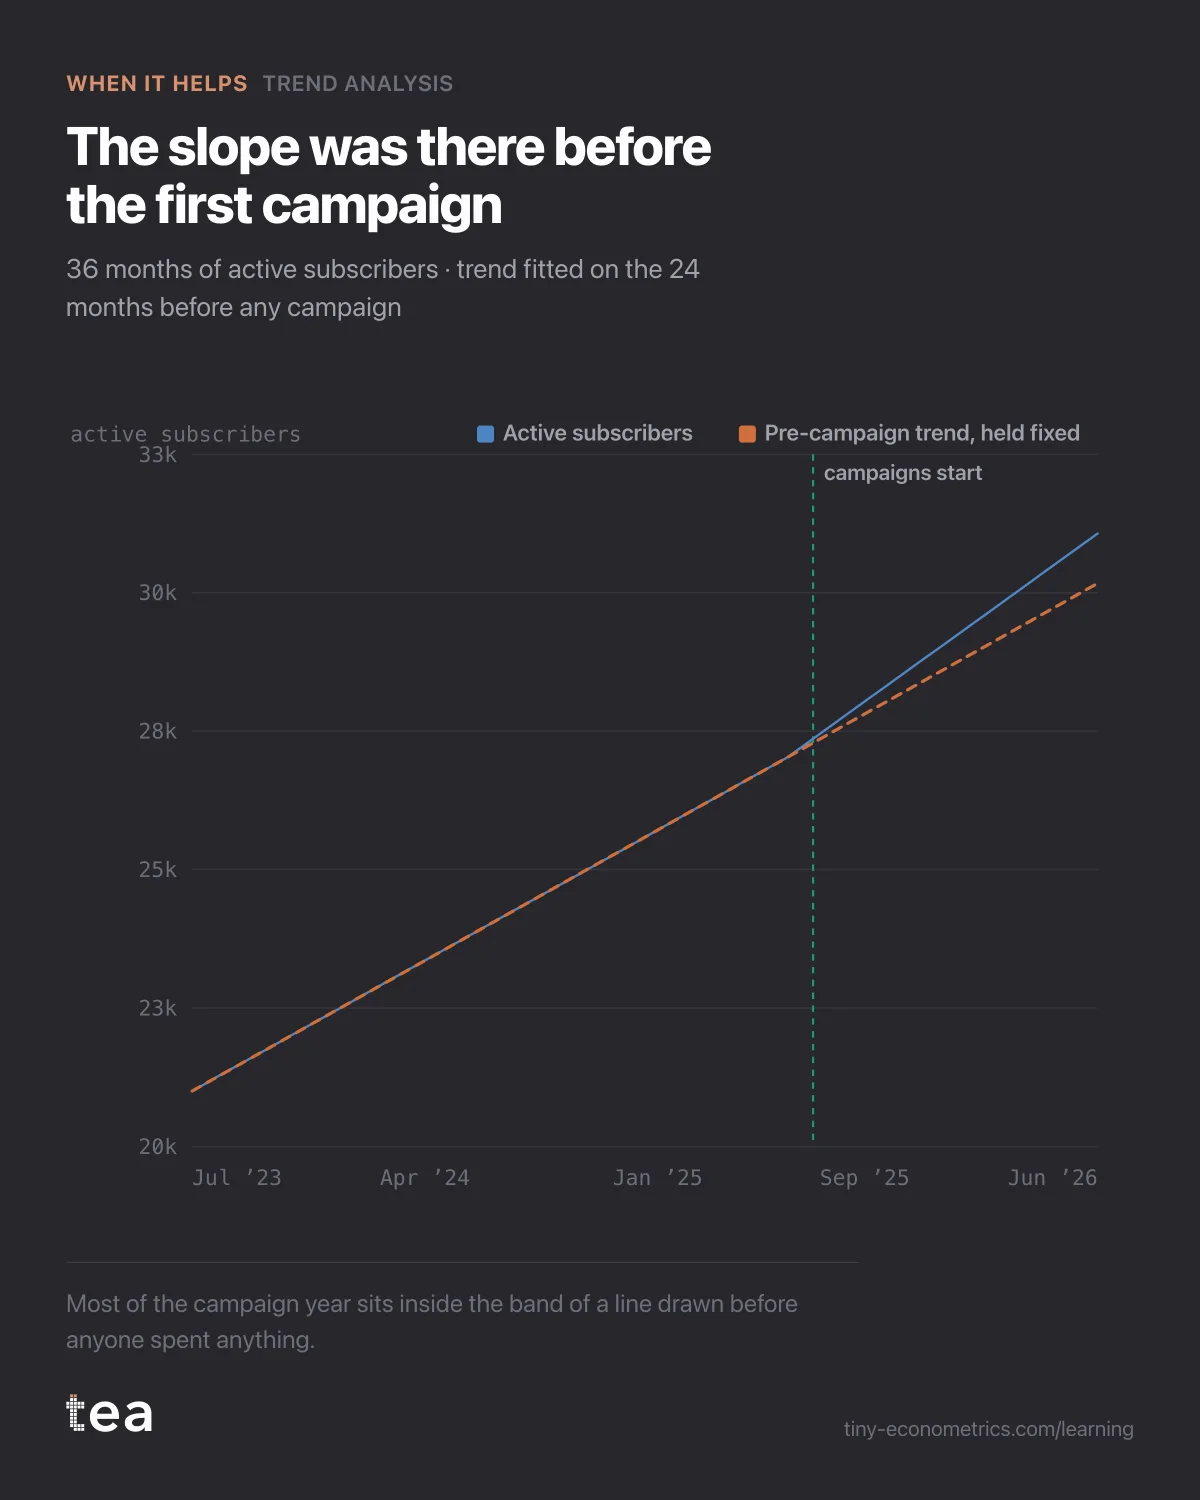
Trend Analysis fitted a straight line on the 24 months before the first campaign. The slope came out at +269 subscribers a month, with a 95% interval from 252 to 286. The standard errors are widened to allow for the fact that consecutive months are not independent draws; a plain regression would have printed a narrower band and been wrong about it.
The fit was clean: residuals scattered around zero without long runs, no step, no listing hiding in the data. The slope earlier in this thread, on a crisps brand with a listing in the middle, was a step in disguise. This one was a slope.
Then the important move: the line was held fixed and extended through the campaign year, with its band. The band widens as it goes, because a slope that is uncertain by a few subscribers a month becomes uncertain by a few hundred after twelve.
What the campaign year really added
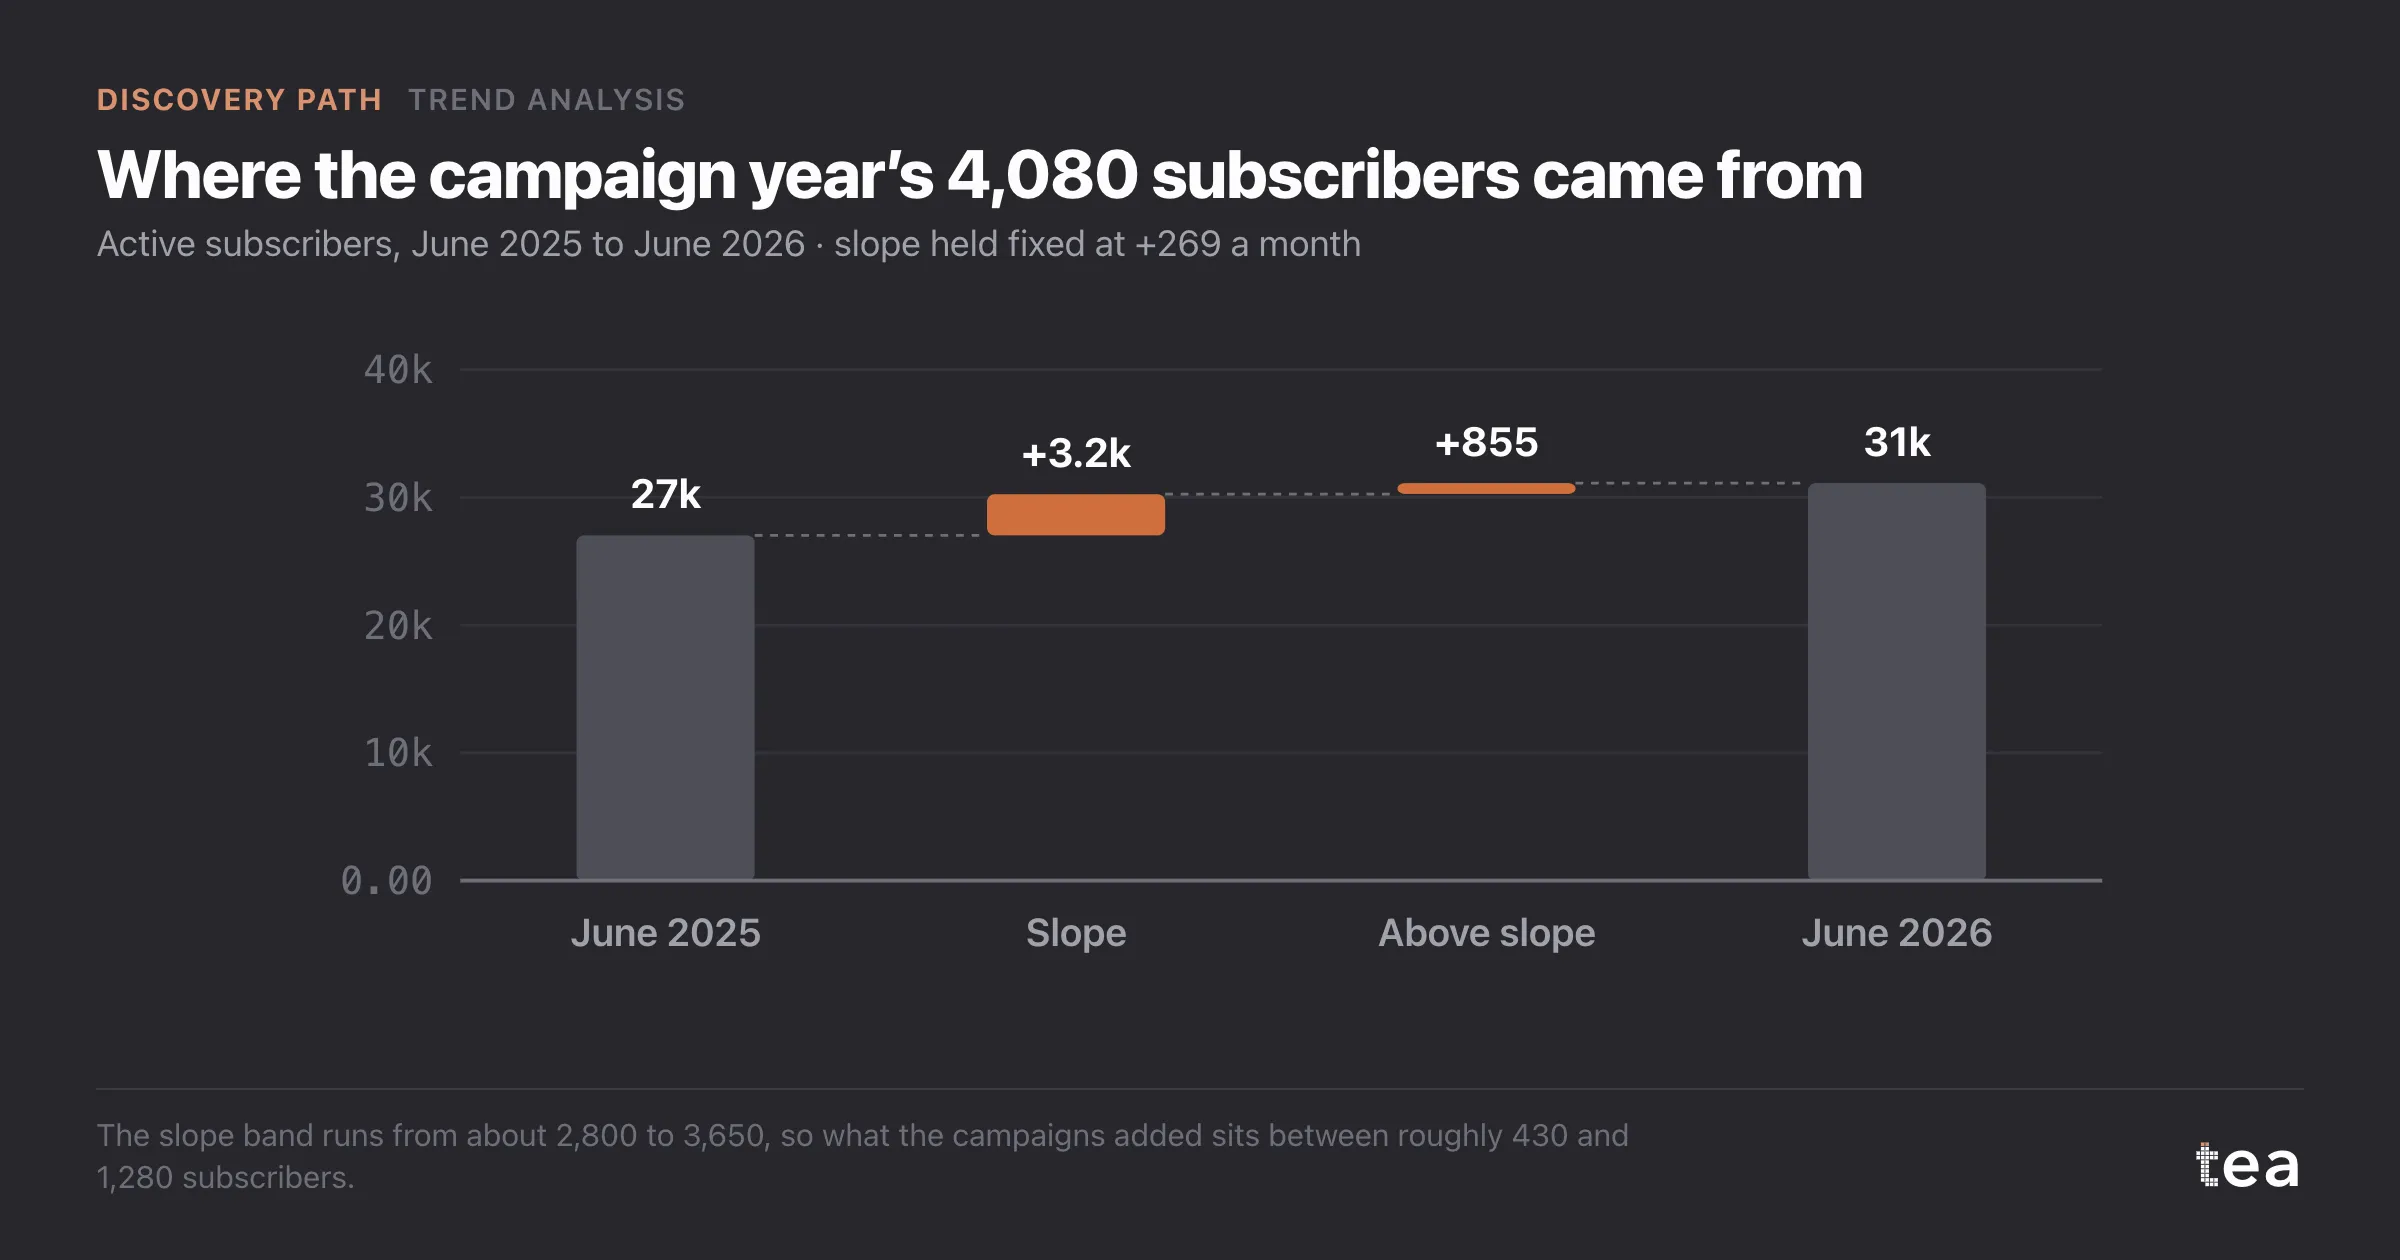
From June 2025 to June 2026, active subscribers went from 27,020 to 31,100. That is the 4,080 in the question.
The pre-campaign slope, on its own, predicts 3,225 of them over the same twelve months, with a band from about 2,800 to 3,650. Word of mouth, gifting, the category growing, whatever was carrying the business before July 2025 did not stop when the campaigns started.
What sits above the slope is 855 subscribers. Allowing for the band, somewhere between roughly 430 and 1,280.
Put the money next to it. Twelve months at €38,000 is €456,000. Divided by 4,080, the deck implied €112 per subscriber. Divided by 855, it is about €533, and anywhere from €356 to €1,060 across the band. The finance team put the gross margin a subscriber brings over their lifetime at around €420. At the central estimate the campaigns did not pay for themselves.
The decision it changed
The doubling did not happen. A request for another €456,000 a year was withdrawn, and spend went down to €25,000 a month while the team designed a proper test: campaigns switched off in Belgium for eight weeks and kept running in the Netherlands, so the next answer comes from variation they create rather than variation they hope for.
Two caveats travel with the number, and they were written into the memo.
Holding a slope fixed assumes the structural engine kept running at the same speed. If the category had accelerated on its own in 2025, the slope understates the base and the campaigns did even less. If it had slowed, the campaigns did more. The trend cannot tell which; it can only make the assumption visible.
And 855 is net growth. If the campaigns brought in subscribers who cancel faster, the gross number was higher and the value lower. The next steps on the Discovery Path, seasonality and then a full driver decomposition, are where those questions get their own column.
The lesson
Before anyone credits growth to marketing, draw the line the business was already on and hold it fixed. What sits on the line was coming anyway. Only what sits above it, with its band, is the campaign's to claim.
The Discovery Path
- Trend analysis with a structural break, and why one line lies
- Subscription growth from marketing, or a slope already there
- Easter, year-on-year comparisons and the quarter that did not fall (out October 7, 2026)
- When TV and branded search collinearity defeats the regression (out October 12, 2026)
- A sales spike credited to influencers, decomposed by driver (out October 17, 2026)
- What would revenue be with zero marketing? The counterfactual year (out October 22, 2026)
- Base vs incremental after a launch, with no base in the data (out October 27, 2026)