French direct-to-consumer mattress brand, 104 weeks of sales and media, asked how much revenue comes from TV and how much from branded search.
A composite case, built from the kind of file we see most weeks. A direct-to-consumer mattress brand in France, around €31M of online revenue, with a TV agency and a search agency who each had a slide explaining that the year belonged to them.
The marketing director's question: "How much of our sales come from TV, and how much from branded search? I need one number for each before the budget round."
It is the most natural question in the Discovery Path, and on this file it had no answer.
What the file looked like
104 weekly rows, two years. Revenue, TV GRPs, branded search spend, generic search, paid social, a promotion flag, and the trend and seasonal terms carried from the earlier steps of the path, Easter dummy included as in the confectionery case. TV ran in flights: twelve weeks on, six weeks off, about €2.6M over the period. Branded search cost about €1.13M.
The detail that decided everything was in the search agency's bidding rule. During TV flights, bids on the brand name went up, because people who see the advert search for the brand and nobody wanted a competitor to take that click. Sensible media practice. Fatal for measurement.
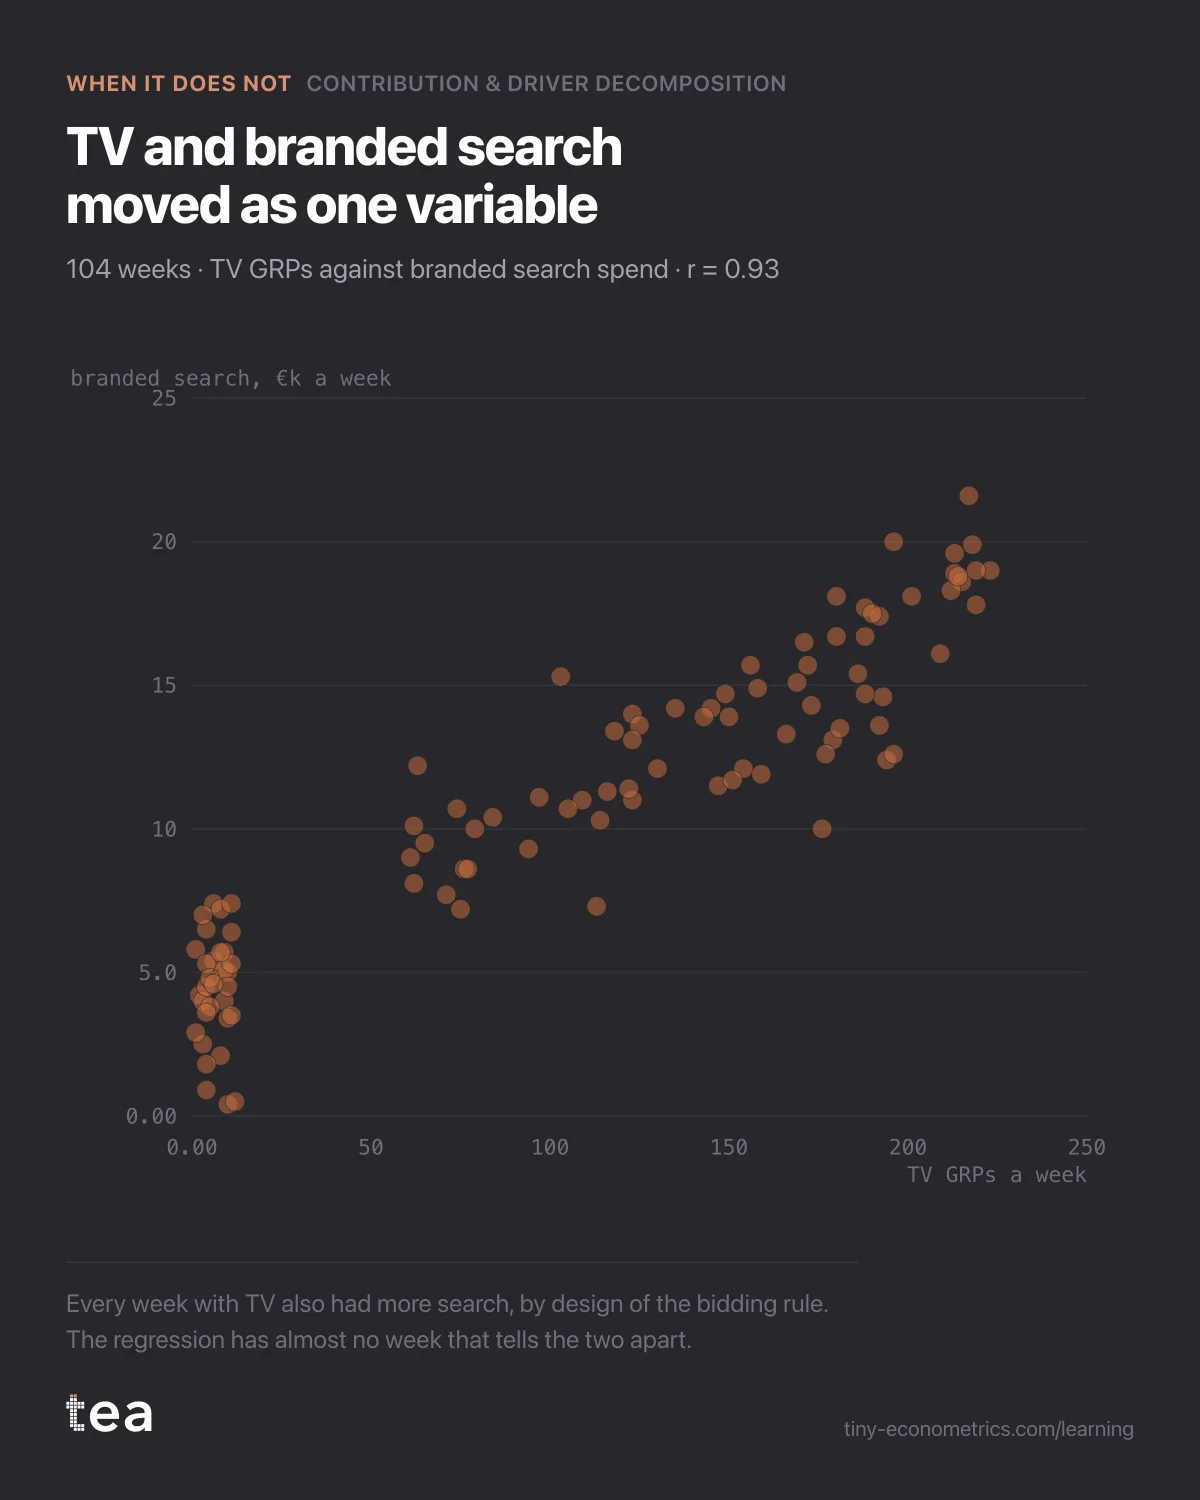
Across the 104 weeks, TV GRPs and branded search spend correlate at r = 0.93. When one went up, the other went up. When TV went dark, search went down. There is almost no week in which the two moved apart.
What the regression could not do
Contribution & Driver Decomposition fits a regression of revenue on all the drivers at once, with adstock on TV so that a flight keeps working after it ends. Each coefficient is the effect of one driver holding the others still.
That phrase, holding the others still, is the whole problem. The model learns what TV does by looking at weeks where TV moved and search did not. This file has almost none of those weeks. So the model can see that "TV plus search" moved revenue, and it cannot see how to divide the credit.
The diagnostic for this is the variance inflation factor. On both channels it came out at 7.8. In plain words: the uncertainty on each coefficient is about 2.8 times wider than it would be if the two channels had moved independently, because the square root of 7.8 is 2.8.
The intervals show it:
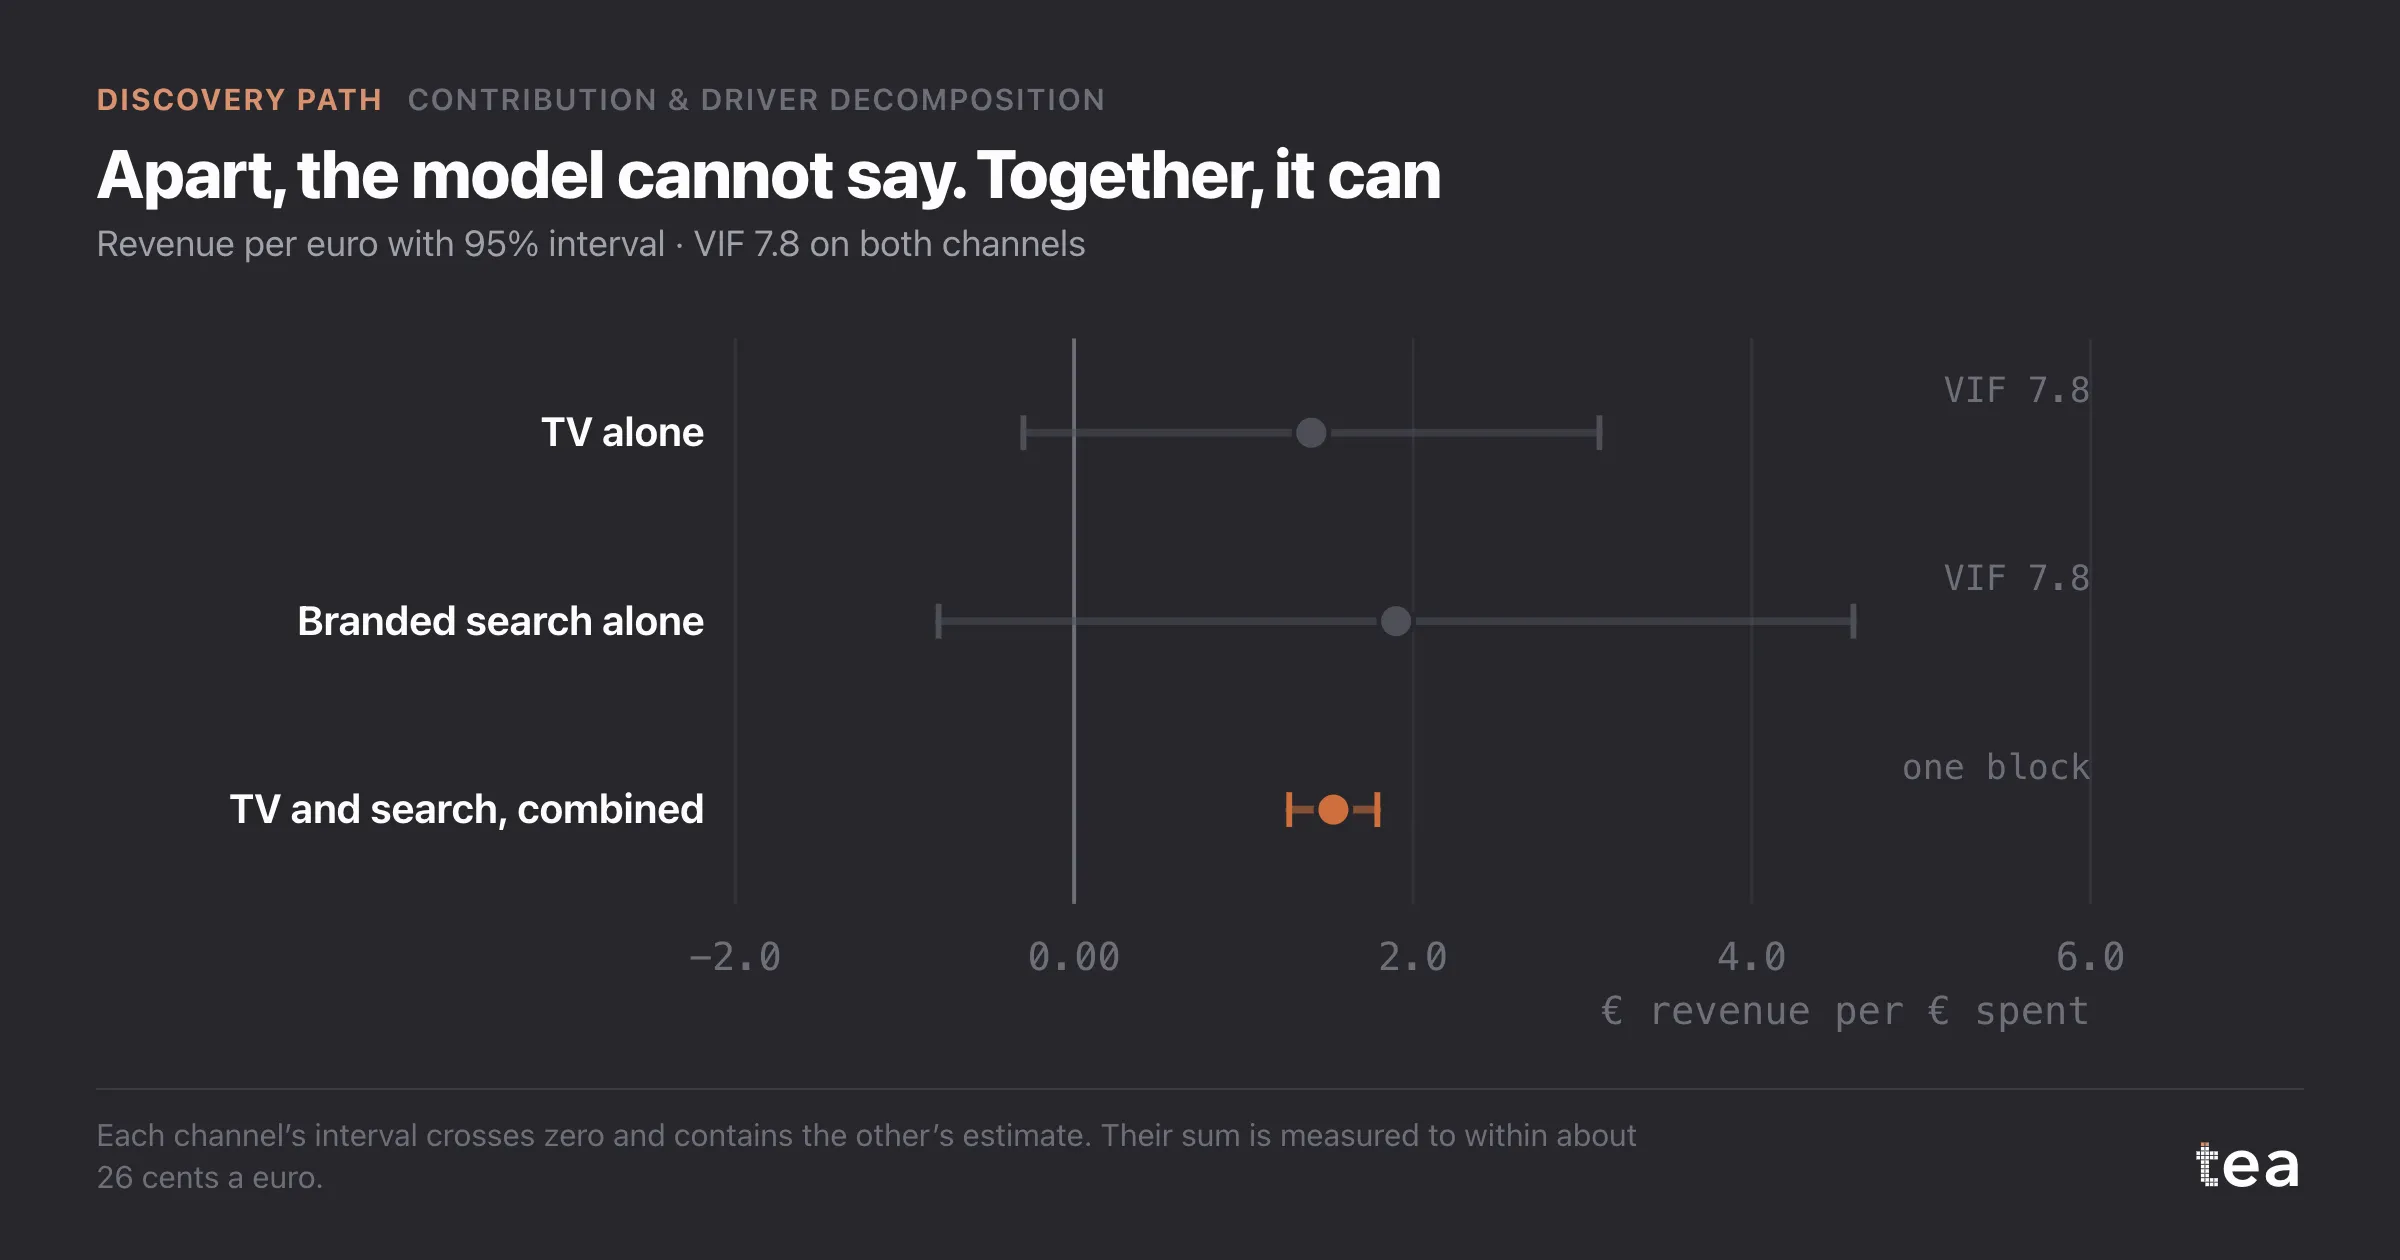
- TV: €1.40 of revenue per euro, 95% interval from -€0.30 to €3.10;
- branded search: €1.90 per euro, interval from -€0.80 to €4.60;
- the two together: €1.53 per euro, interval from €1.27 to €1.79.
Each channel's interval crosses zero and contains the other channel's estimate. Their sum is measured to within about 26 cents. The data know what the pair did. They do not know who did it.
What would have gone wrong if forced
The point estimates say search returns more than TV. Read literally, they suggest moving money from TV to search. Remove eight weeks from the sample and refit, and the ranking flips. Two people running the same analysis on slightly different date ranges would bring opposite recommendations to the same meeting, both with a regression behind them.
Worse, the "search wins" reading is probably backwards in mechanism. If TV makes people search for the brand, part of what branded search collects was created by TV. A cut to TV would then lower branded search volume too, and the model, trained on a world where they always moved together, would never have warned anyone.
What to do instead
Combine. Report TV and branded search as one block, €1.53 per euro with its tight interval, and plan them together. It is a less exciting answer and it is the true one.
Bring a prior from a test. A branded search holdout, with bids on the brand name paused in a few regions for four to six weeks, measures how much of that traffic would have arrived organically. That number can then fix one coefficient, and the regression only has to estimate the other.
Break the correlation on purpose. For the next two flights, decouple the bidding rule: keep branded bids flat in alternating weeks, or let one flight run with search unchanged. Twelve to sixteen weeks of independent movement is usually enough for the variance inflation to fall below 3.
tea does not run the test. It will read the file that comes out of it.
The lesson
A regression can only separate drivers that the data separate. When two channels are planned together, they are measured together. If you want to know what each one does, one of them has to move on its own, sometimes, on purpose.
tea, the product
Your file, this question
Fifteen analyses on a CSV of weekly data, with the intervals and the diagnostics shown, and a plain sentence when the data cannot answer. Free while in beta, by invitation.
Request a place in the beta→tea, the product
Fifteen econometric analyses on your own CSV: Contribution & Driver Decomposition, saturation curves, elasticities, budget allocation. Intervals and diagnostics shown, and a plain sentence when the file cannot answer.
Free while in beta, by invitation.
Request a place in the beta →Liked this? Run it on your own data.
tea runs Contribution & Driver Decomposition and fourteen other analyses on any weekly CSV, in minutes. Free while in beta, by invitation.
The Discovery Story
- Trend analysis with a structural break, and why one line lies
- Subscription growth from marketing, or a slope already there
- Easter, year-on-year comparisons and the quarter that did not fall
- When TV and branded search collinearity defeats the regression
- A sales spike credited to influencers, decomposed by driver
- What would revenue be with zero marketing? The counterfactual year (out October 22, 2026)
- Base vs incremental after a launch, with no base in the data (out October 27, 2026)