"Black Friday delivered plus 210%." A sentence like that is either the most important line in the deck or completely meaningless, and the difference is whether anything was held constant while it was measured.
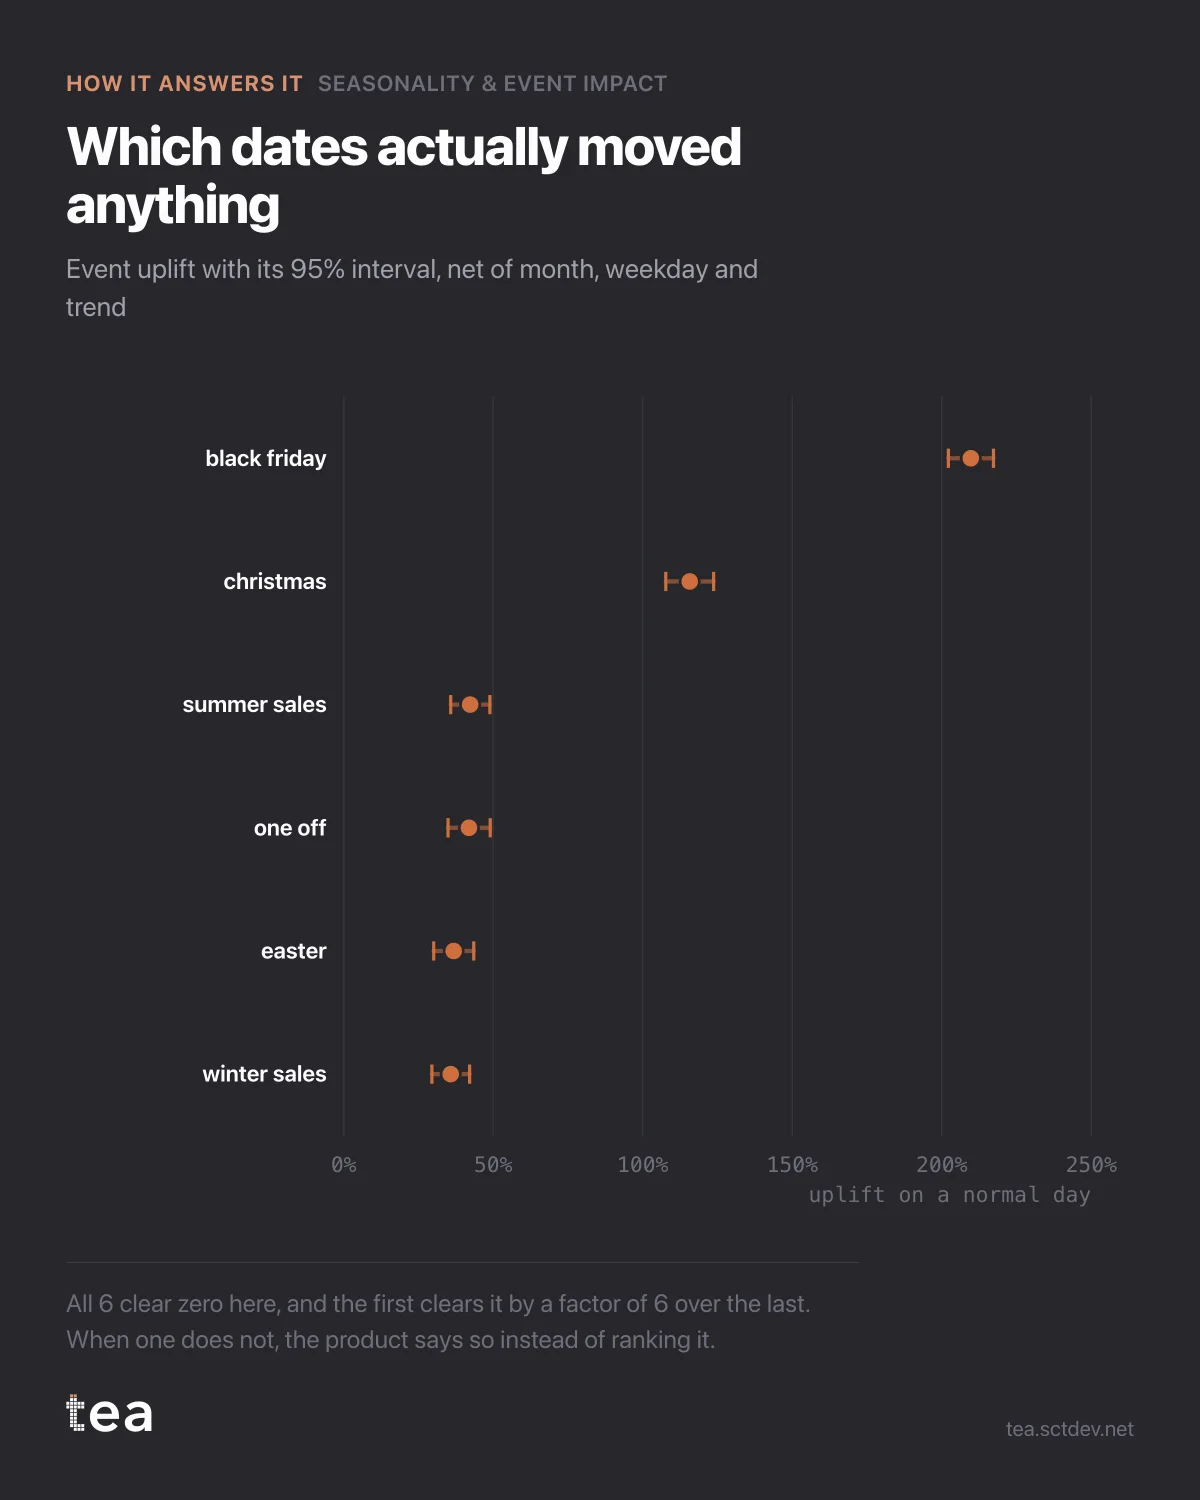
This chart is the honest version. Six events, each with its uplift and its 95% interval, estimated net of the month, the weekday and the trend.
Black Friday: +210%. Christmas: +116%. Then the long tail, where the interesting decisions live: summer sales +42%, a one off campaign +42%, Easter +37%, winter sales +36%.
Two things to notice before the ranking.
The intervals are narrow, and all six clear zero. That is what a well specified event model looks like when the events are genuinely large and genuinely dated. When an interval crosses zero, the correct reading is that the event did nothing you can prove, and the product says so rather than ranking it anyway. Ranking a set of numbers that includes noise is how a promotional calendar gets built on a coin toss.
The second is the arithmetic that never makes the summary. Black Friday appears 18 times in this file and returns +210% on a normal day. Winter sales appear 45 times and return +36%. Which of those is worth more over a year? The one with the smaller uplift, by a wide margin, because it runs two and a half times as often. Uplift is a rate. Contribution is a rate times a count, and only one of them gets put in the headline.
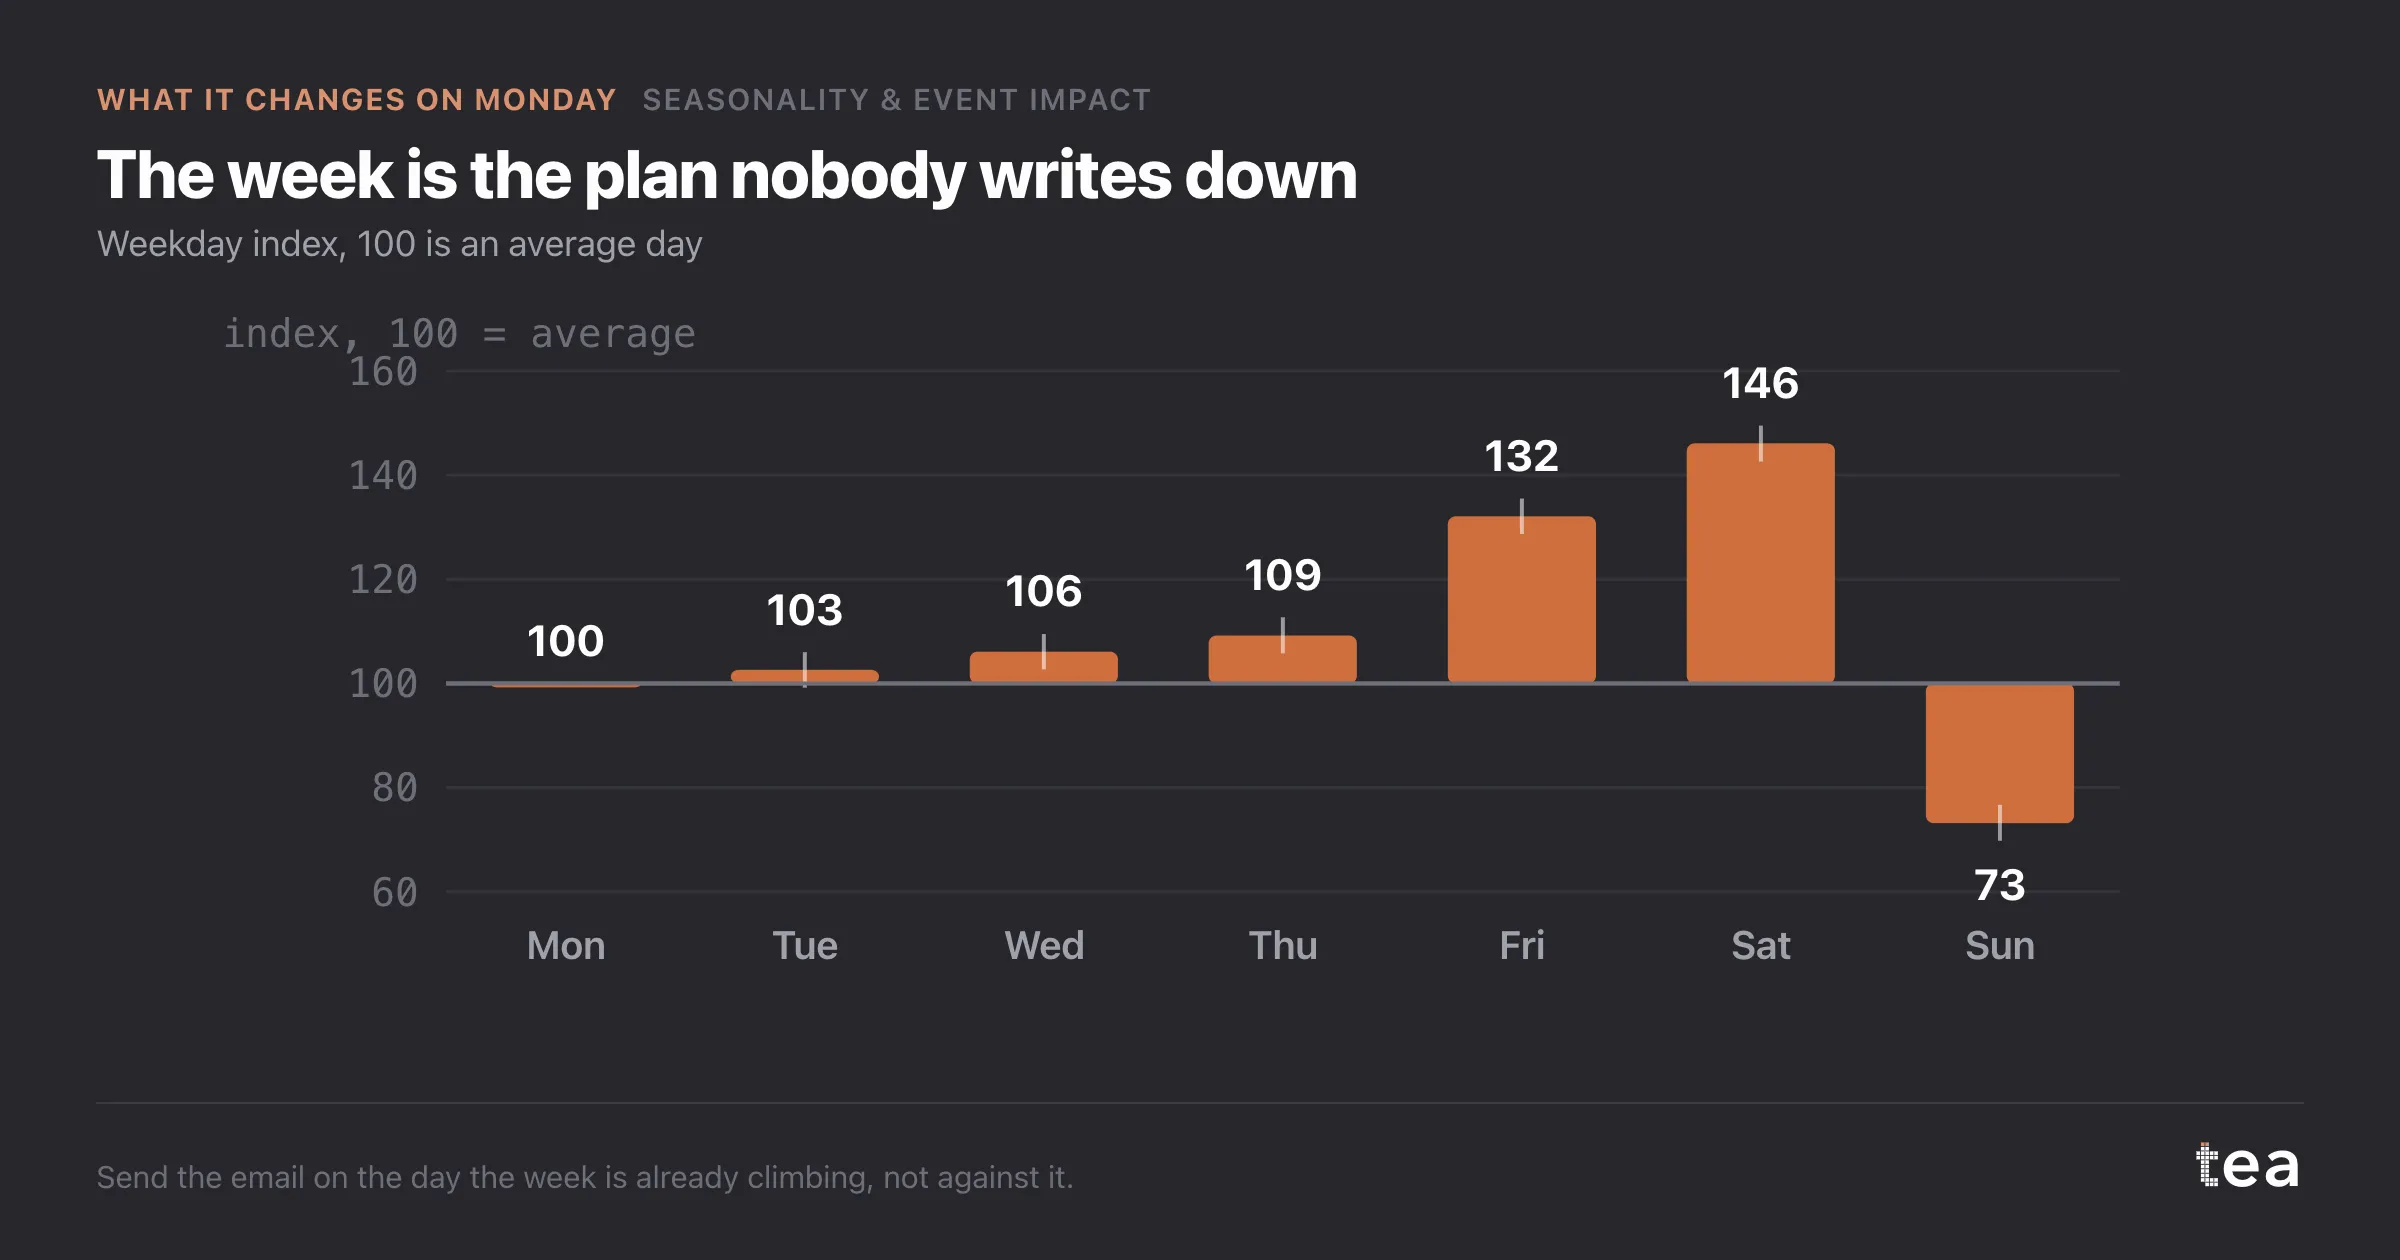
How the estimate is built matters too. Each event is a dummy taking the days it actually ran, fitted alongside month and weekday terms. Without those controls, Black Friday absorbs all of late November, Christmas absorbs December, and the month effects vanish into the events. With them, each term has to earn its coefficient against the others, and the numbers stop competing for the same credit.
One last discipline. Events overlap: a sale that runs into a holiday, a launch on a peak weekend. When two dummies cover the same days, the model cannot separate them, and TEA flags the overlap rather than splitting the credit silently.
The practical version of all this fits on one line. Before you compare two events, check that both intervals are away from zero, then multiply each uplift by how often it runs. The ranking you get is frequently not the ranking in the end of year review.
And when an event does cross zero, that is a finding worth acting on rather than a gap in the analysis. It usually means the event is too small to separate from the season it sits in, and the honest options are to run it more often, run it bigger, or stop paying for it.
The chart is the actual output of Seasonality & Event Impact in TEA.
tea, the product
Your file, this question
Fifteen analyses on a CSV of weekly data, with the intervals and the diagnostics shown, and a plain sentence when the data cannot answer. Free while in beta, by invitation.
Request a place in the beta→tea, the product
Fifteen econometric analyses on your own CSV: Seasonality & Event Impact, saturation curves, elasticities, budget allocation. Intervals and diagnostics shown, and a plain sentence when the file cannot answer.
Free while in beta, by invitation.
Request a place in the beta →Liked this? Run it on your own data.
tea runs Seasonality & Event Impact and fourteen other analyses on any weekly CSV, in minutes. Free while in beta, by invitation.