ea

Analyses/Discovery Path/Seasonality & Event Impact

What the calendar does before anyone spends.

Seasonality & Event Impact fits the month, the weekday, the trend and every dated event in one regression, so each is measured net of the others. Christmas is not a media result, and Easter in a different quarter is not a bad quarter.

Answers How much of this movement is the calendar? Needs Daily, weekly or monthly KPI, and the event dates Hands back Seasonal profiles, lift per event, intervals

The same business, with Easter in a different quarter

weekly revenue, weeks 1 to 26, €k
  • 2024
  • 2025
The Easter weeks+38%on an ordinary week, interval 31 to 45
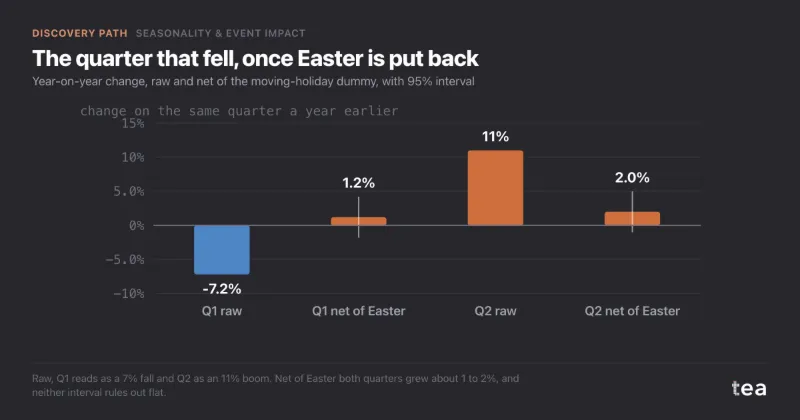
Q1 on Q1, raw−7.2%+1.2% once Easter is taken out
Q2 on Q2, raw+11.0%+2.0% once Easter is taken out

The Italian confectionery brand of the first example below. A composite case: your file draws its own calendar, with an interval on every event.

01

What it is for

Most of what a sales line does in a year is decided by the date. The calendar has to be measured and set aside before anything else gets credit, and it has two parts: the shape every year shares, and the dated events that move around it.

Clearing the calendar before attribution

A campaign in December looks brilliant and the same campaign in August looks broken. Neither result is about the campaign until the month and the weekday have been taken out.

Comparing periods that hold different events

Easter, Black Friday against early December, a bank holiday on a Monday one year and a Thursday the next. A year-on-year number across a moving event compares the events, not the business.

Deciding which dates are worth the money

Each event gets a lift and an interval. A lift that clears zero, multiplied by how often the event runs, is what it is worth in a year. One that does not clear zero is a candidate to stop paying for.

02

How to read it

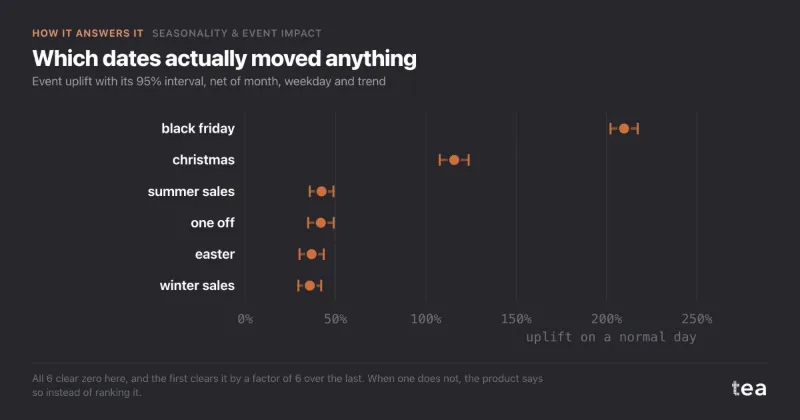
The Event deep-dive shows one event at a time, in five cards. Here, Black Friday on three years of daily revenue of a specialty retailer, beside the uplift chart of all six events. Read the cards in this order.

Black Friday
Uplift % +209.7%1 β (KPI units) 30.5k2 95% CI [29.4k, 31.6k]3 p-value 0.0004 Occurrences 185

Event uplift, top 6

  1. The uplift. The event’s coefficient as a share of the average day in the file, after the month, the weekday and the trend have taken their part. +209.7% means a Black Friday day adds about twice an ordinary day’s revenue on top of what its date would have sold anyway.
  2. The coefficient, β. The same effect in the unit of the KPI: €30.5k a day here, in euro of daily revenue. It is the number to multiply, by days or by weeks, when the question is what the event is worth.
  3. The interval. Where the true effect probably lies, in the same unit. When it crosses zero, the event did nothing the file can prove, whatever the uplift says.
  4. The p-value. Read against the significance chosen in the controls, 0.05 unless you change it. Below it, the card turns green and the bar in the uplift chart is drawn full; above it, washed out.
  5. The occurrences. How many rows the event was on: 18 days across three years here. An uplift is a rate, and a rate measured on two days is an anecdote. Below three, the reading beside the cards says to treat it as indicative.

03

Where it sits in the analysis

Seasonality & Event Impact is the second step of the Discovery Path, straight after Trend Analysis. The slope comes first and is held fixed, so a holiday cannot borrow growth from it. Then the calendar is measured, before any driver is allowed to claim a peak.

What you carry into the next step is the seasonal profile and the event effects. Contribution Decomposition takes them as given, so the media and the promotions are measured on what the calendar leaves.

It is also the third step of the Planning Path, after the forecast: there the indices are what next March is planned on, and they are only as clean as the years they were averaged over.

Also a step of the Planning Path.

Discovery Path

  1. Trend Analysis

    Reads the structural slope first, with its confidence band, so nothing that follows gets credit for it.

  2. Seasonality & Event Impact this page

    Separates the calendar from the campaigns. Christmas is not a media result.

    Carries forward: the seasonal profile, subtracted before attribution

  3. Contribution & Driver Decomposition

    Gives every driver its share of the KPI: media, promo, price, controls, week by week.

  4. Base vs Incremental

    Collapses the drivers into the split a CMO actually asks for, with the counterfactual year underneath.

04

Where it usually misleads

The regression is plain least squares with a column per month and a column per event. What goes wrong is in what the columns are asked to separate, and a fitted coefficient looks the same whether it was identified or not.

An event that happened once

A dummy that marks one week has nothing to average: its coefficient is whatever that week did beyond the rest of the model, weather, a retailer deal and all. The interval is the noise of a single week, and it usually crosses zero. Second example below.

Every event shows how many times it occurred. A reading on fewer than three occurrences says to treat it as indicative, and one that is not significant says not to plan against it yet.

Two events on the same days

A sponsorship in a bank-holiday week, a sale that runs into Christmas. When two dummies are on together, the model is asked to split one set of days between two causes, and any split it returns is arithmetic, not evidence.

Events that share half their days or more are named in an attribution warning above the results.

Fixed periods compared across a moving holiday

Easter moved from March 2024 to April 2025, and three weeks of trade crossed from Q1 to Q2. A quarterly report read a collapse and a boom in the same business. Nothing in the file said “Easter”, so nothing could take it out. First example below.

Load a holiday pack for Italy, the UK, the US or Germany in the events step: Easter and the other moving holidays come in on their actual date in each year of the file.

Last year’s weather booked to the calendar

A month index is an average of the years in the file. When two of four Marches were warm, their sunshine is booked as March, and next March is planned on last year’s luck. Any outside force that lands unevenly on the years does the same.

Mark the warm weeks, or any recurring outside force, as a column of ones and zeros in your file and tick it in the events step: it is fitted as its own event, net of the month.

An uplift ranked without its count

Black Friday at +210% heads every ranking. But an uplift is a rate on the days an event runs, and what it is worth in a year is that rate times the number of days. A short event with a big lift and a long one with a small lift are compared on half the arithmetic.

The occurrences sit beside the lift in the events table, and events that are not significant are drawn washed out in the uplift chart.

Growth taken for the season

In a growing business every later month of the year is a little higher than the earlier ones. A calendar fitted without a trend books that growth to autumn and winter, and the profile tilts towards December for a reason that has nothing to do with December.

A linear trend is fitted with the calendar by default, and can be set to quadratic, or removed, in the controls.

05

Two examples

One file where a moving holiday was taken for a business problem, one where a single event could not be separated from its week. Both are useful results.

Helps

The quarter that did not fall

An Italian confectionery brand, about €22M of revenue through grocery, moved to new packaging in January 2025. Q1 came in 7.2% down on the year before, and going back to the old design was quoted at about €180,000. Easter Sunday had fallen on 31 March 2024 and on 20 April 2025: the three weeks of Easter trade had left the quarter.

Easter went in as an event on its actual dates across 182 weeks, and because it wandered across 21 days over four years, the model could tell it from the week of the year. The Easter weeks ran 38% above an ordinary week, interval 31% to 45%. Net of Easter, Q1 was +1.2% and Q2 +2.0%, not −7.2% and +11.0%. The reversal was shelved and the €180,000 stayed in the budget.

Read the full case

Year-on-year change, raw and net of Easter

change on the same quarter a year earlier, 95% interval
  • Raw
  • Net of Easter, with interval

Raw, a collapse and a boom. Net of Easter, growth of 1 to 2% in both quarters, and neither interval rules out flat.
Does not help

One cup final, one week

A craft brewery in the north of England sponsored a regional cup final in late May 2026 and, with a renewal offer on the table, asked what it had been worth. The week of the final was up 24% on the six weeks either side. It was also the late-May bank holiday, half-term, the first warm days of spring, and a supermarket deal on the 4-pack.

On 156 weeks the recurring events came out clean: Christmas +41%, interval 33% to 49%. The final, marked on a single week, came out at +14% with an interval from −6% to +34%, and an overlap flag with the bank holiday. The honest answer was a design, not a number: a regional contrast, and a sponsored week without a promotion in it.

Three calendar effects and one week that proves nothing

uplift on a normal week, 95% interval

With one occurrence the dummy copies that week’s leftover, and its interval is the noise of one week. It crosses zero.

06

What the charts add to the numbers

A coefficient per month and per event is a table nobody reads twice. Each chart answers one planning question, and the last one shows what is left once the calendar is gone. All three are the product’s output on three years of daily revenue of a specialty retailer.

Month profile

index, January = 100

Reads as: what each month sells on its own, against the reference month, January. August at 68 and December at 135 are a factor of two that no marketing team decided. It is the chart for setting monthly targets that are not an annual figure divided by twelve.

Day-of-week profile

index, Monday = 100

Reads as: where the week already climbs. Saturday at 146 and Sunday at 73 on daily data: an email, a launch or a test split across them measures the weekday before it measures the creative. It is drawn only when the file is daily.

Adjusted vs raw trend

average day in each week from January 2023, €k
  • Raw
  • Seasonally adjusted

Reads as: what is left once the recurring calendar is taken out: trend, events and noise. The August troughs mostly fill in, and the slope underneath becomes visible, while Black Friday and Christmas stay, because they are events, not season. It is the series the next analysis should be reading.

tea, the product

Measure your own calendar

A CSV with a date and a KPI, and the dates of your events or a holiday pack. The month and weekday profiles, the lift of every event with its interval, and a warning when two of them cannot be told apart. Free while in beta, by invitation.

Request a place in the beta

tea, the product

Fifteen econometric analyses on your own CSV: Seasonality & Event Impact, saturation curves, elasticities, budget allocation. The diagnostics shown, and a plain sentence when the file cannot answer.

Free while in beta, by invitation.

Request a place in the beta →

Now run it on your own data.

tea runs Seasonality & Event Impact and fourteen other analyses on any weekly CSV, in minutes. Free while in beta, by invitation.

Join the beta