Before you trust it, read what it fits.
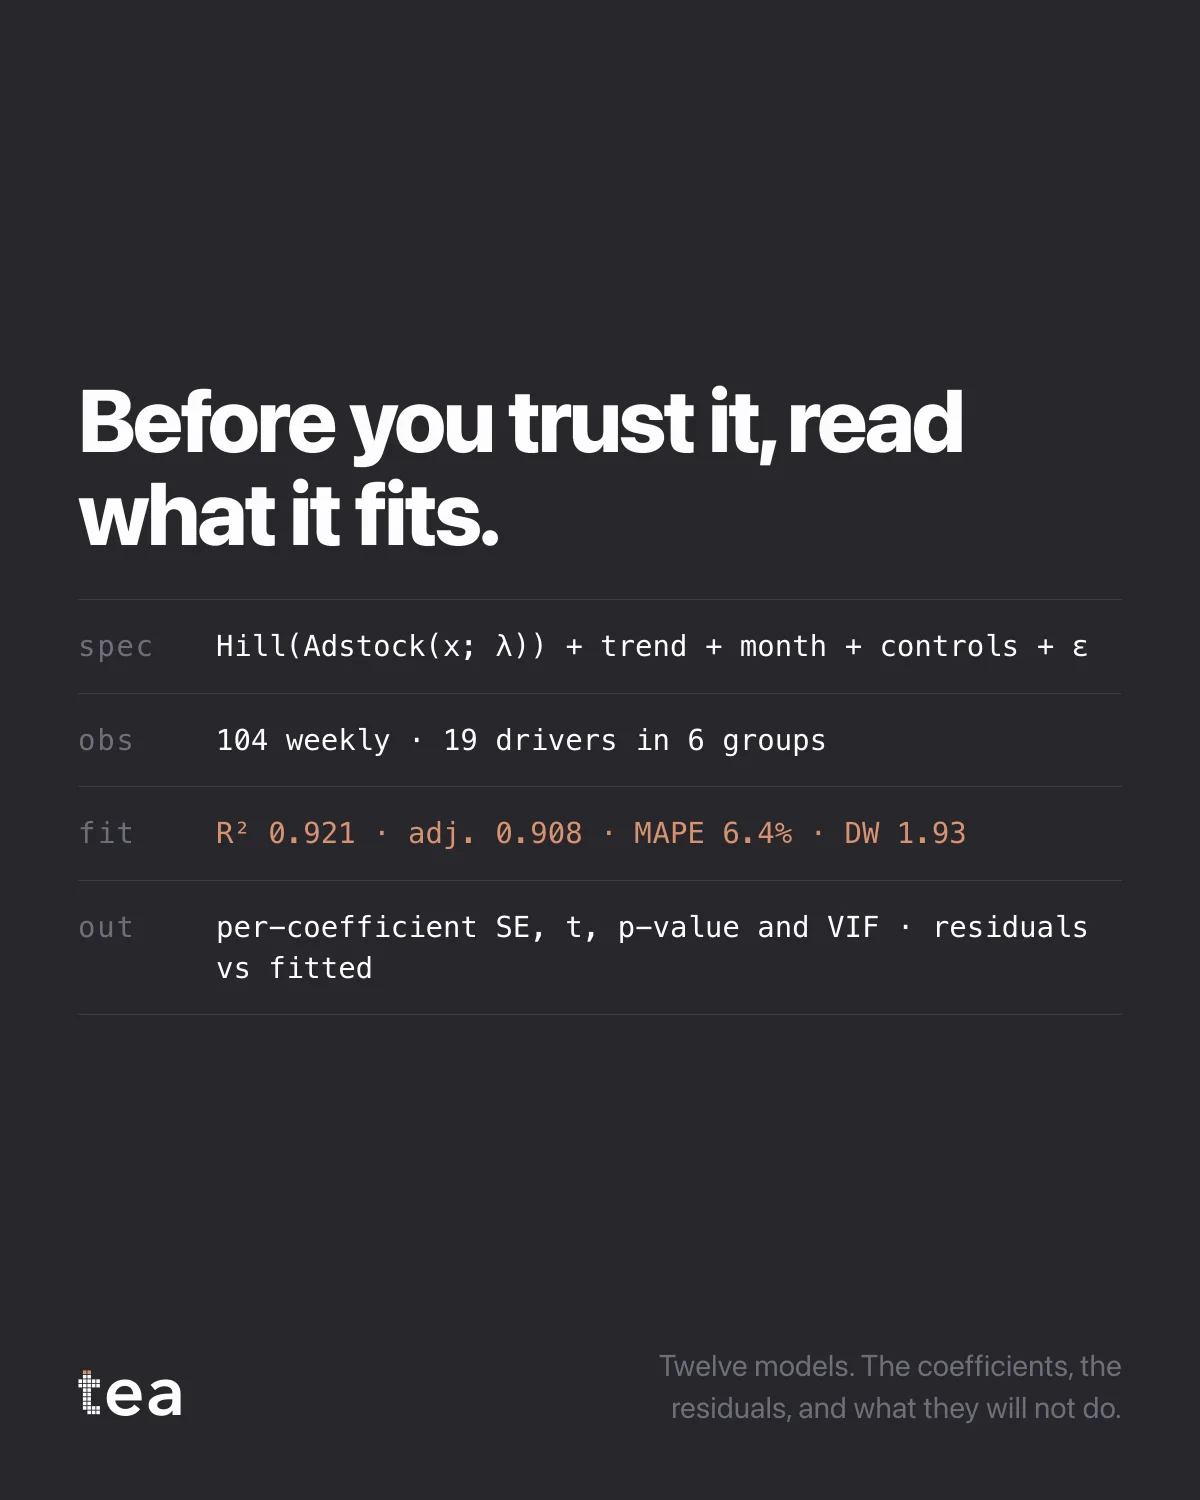
Four lines, and they are the four a data manager asks for before anything else:
The specification: Hill(Adstock(x; λ)) + trend + month + controls + ε. The observations: 104 weekly rows, 19 drivers in 6 groups. The fit: R² 0.921, adjusted 0.908, MAPE 6.4%, Durbin-Watson 1.93. The output: per-coefficient standard error, t, p-value and VIF, plus residuals against fitted.
Nothing in that list is unusual. What is unusual is that it appears at all, on the same screen as the result, without anyone asking.
Most marketing analytics tools present a conclusion and keep the model behind a support ticket. That works until the person receiving the conclusion is the person who owns the data, and then it fails completely, because the first question is always the same: what did you fit, on what, and how do I check it.
Three reasons this matters beyond politeness to analysts.
A model you cannot inspect cannot be challenged, and a number that cannot be challenged does not survive contact with a finance review. It gets quietly dropped rather than argued with.
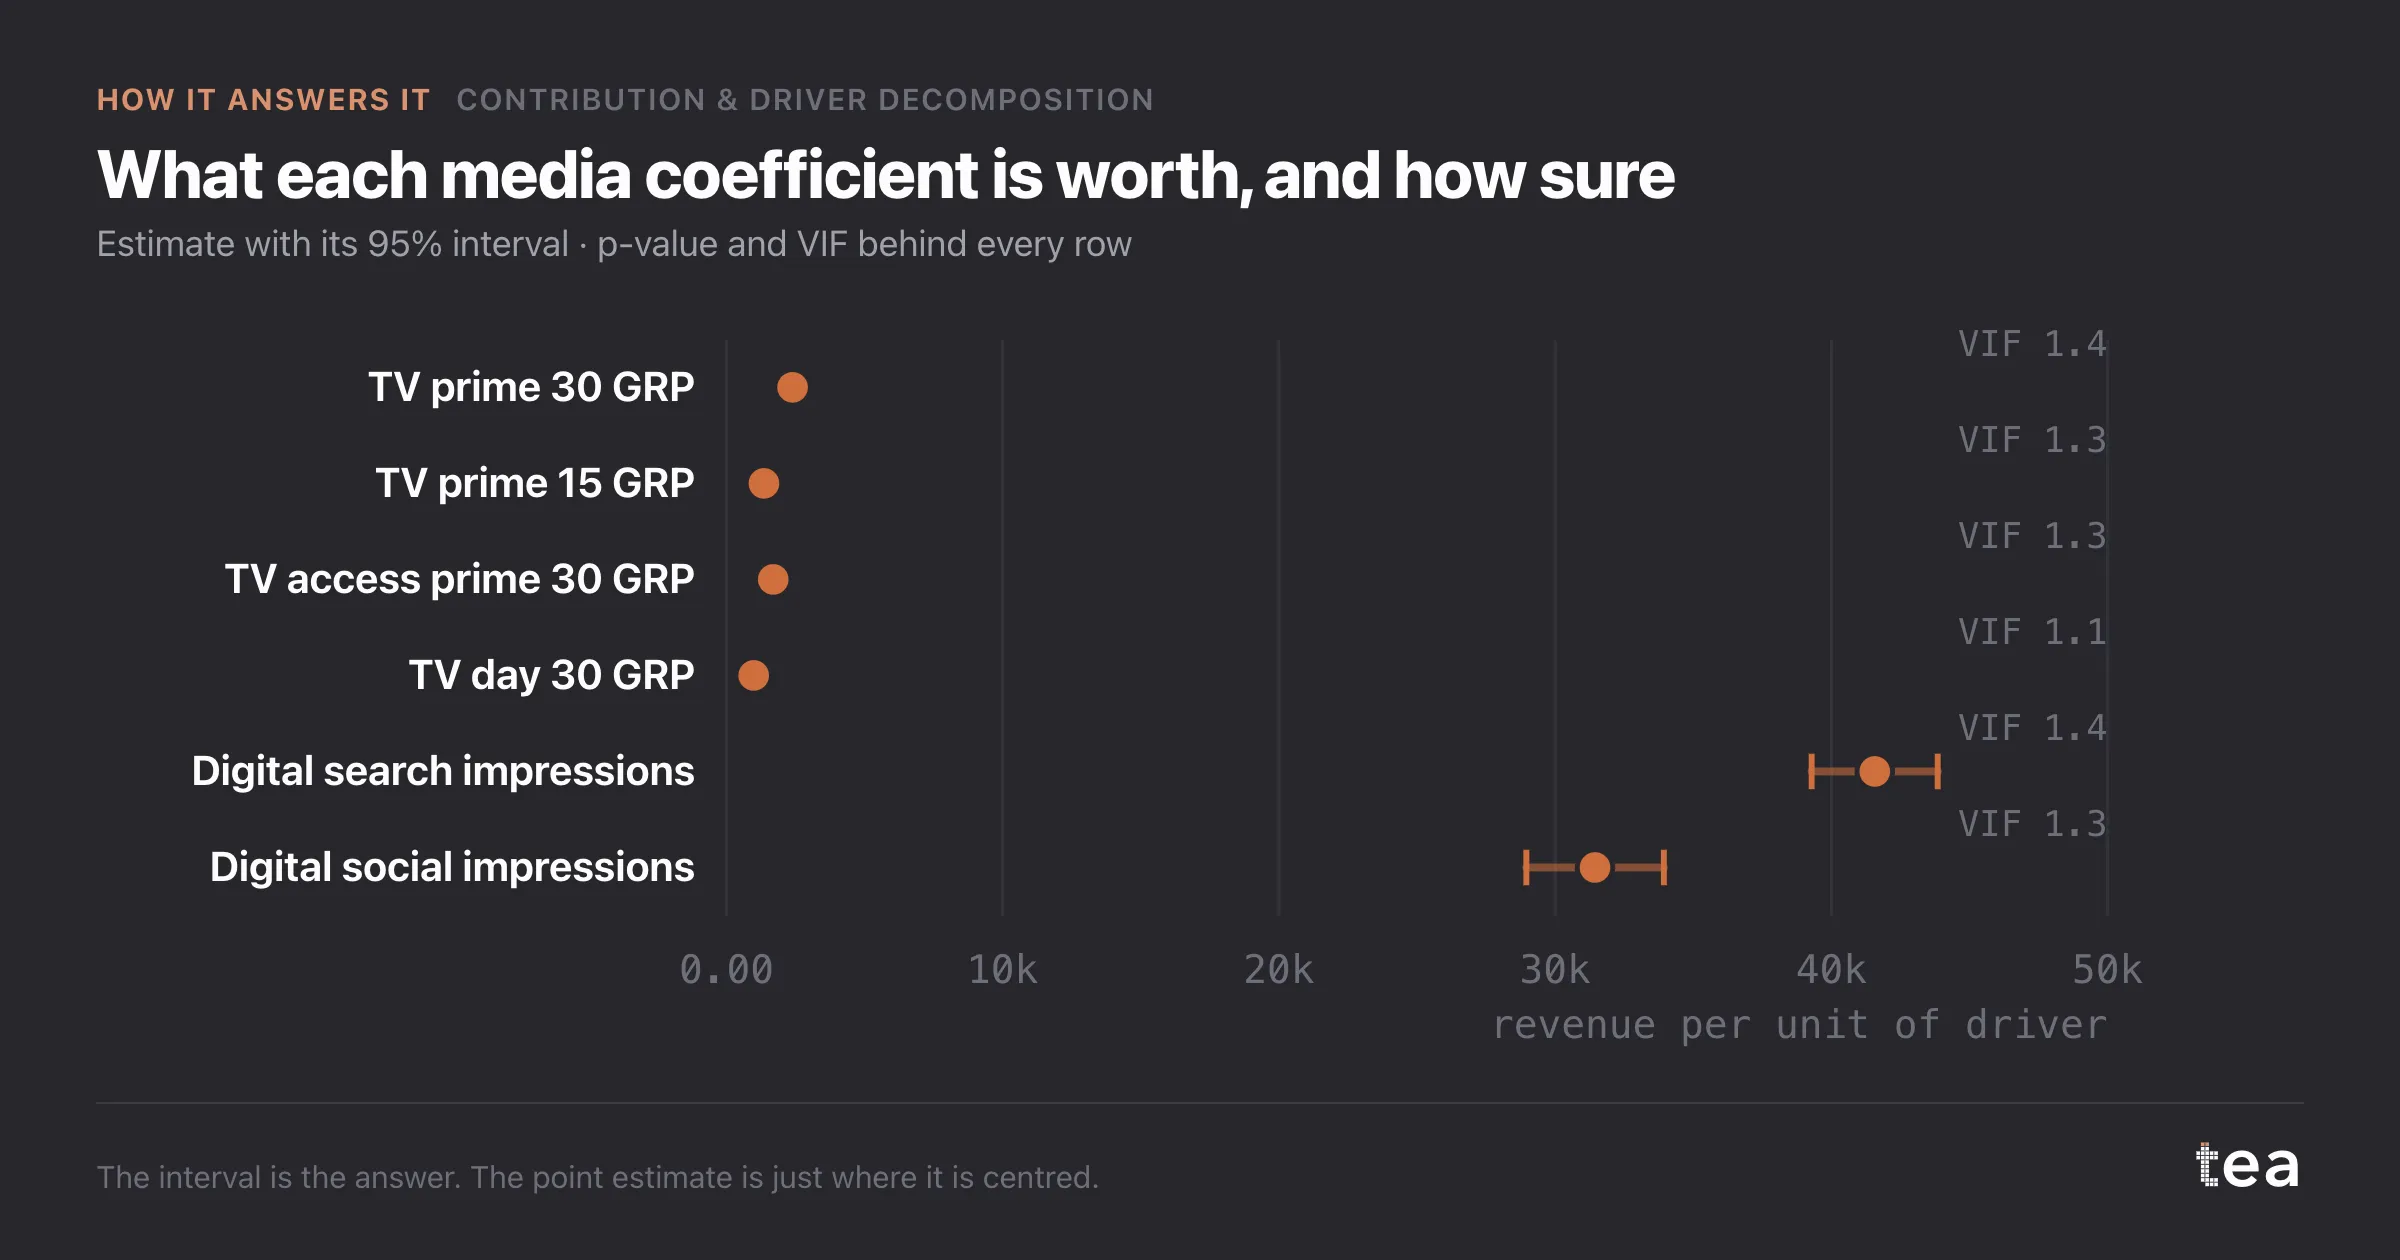
Diagnostics are not decoration. Durbin-Watson at 1.93 says the residuals are not strongly autocorrelated, which is the condition under which the intervals on those coefficients mean what they claim. Without it, every standard error on the page is optimistic.
And the VIF column is where media models fail quietly. Channels that flight together produce coefficients that trade places with each other. The total contribution can be right while every individual driver is unreliable, and only the collinearity diagnostics will tell you.
The principle we build to is simple: anything a reviewer would need in order to disagree with the result should be on the same page as the result.
Twelve models, the coefficients, the residuals, and what they will not do.
A note on where this bites hardest. The person who owns the data is usually the person who gets asked to defend the model to someone else, and they are almost never the person who built it. Everything on that four line card exists so that defence is possible without a phone call.
The same card also makes refusal possible, which matters more. When the fit is poor, or the collinearity is high, or the period is too short, an analyst with the diagnostics in front of them can say "not on this data" with evidence. Without them, the only options are to accept the number or to distrust the tool, and both of those end badly.
tea, the product
Your file, this question
Fifteen analyses on a CSV of weekly data, with the intervals and the diagnostics shown, and a plain sentence when the data cannot answer. Free while in beta, by invitation.
Request a place in the beta→tea, the product
Fifteen econometric analyses on your own CSV: Contribution & Driver Decomposition, saturation curves, elasticities, budget allocation. Intervals and diagnostics shown, and a plain sentence when the file cannot answer.
Free while in beta, by invitation.
Request a place in the beta →Liked this? Run it on your own data.
tea runs Contribution & Driver Decomposition and fourteen other analyses on any weekly CSV, in minutes. Free while in beta, by invitation.