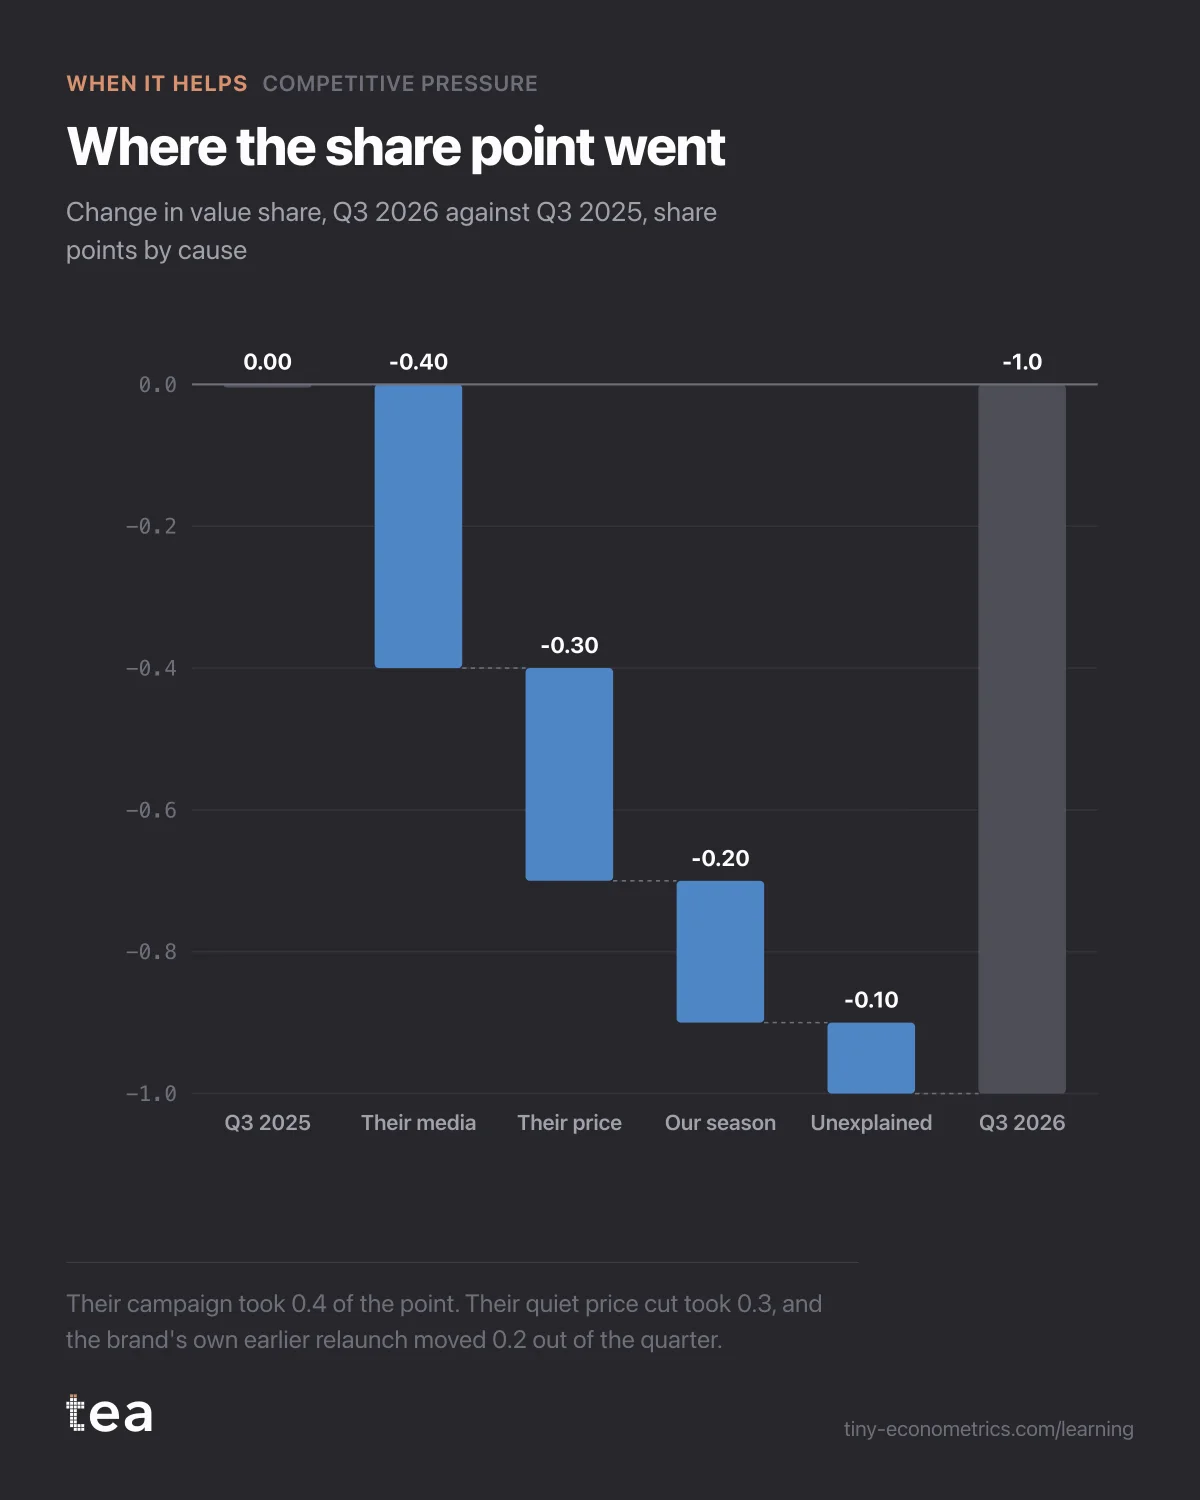
French premium pet food brand, 14.3% of a €410M category, asking how much of a lost share point a rival's campaign took.
A composite case, built from the kind of file we see most weeks: a French premium dry pet food brand holding 14.3% of a category worth about €410M a year across grocery and specialist stores. In the third quarter of 2026 its share was 13.3%. One point, about €4.1M of annual sales at category scale.
The question
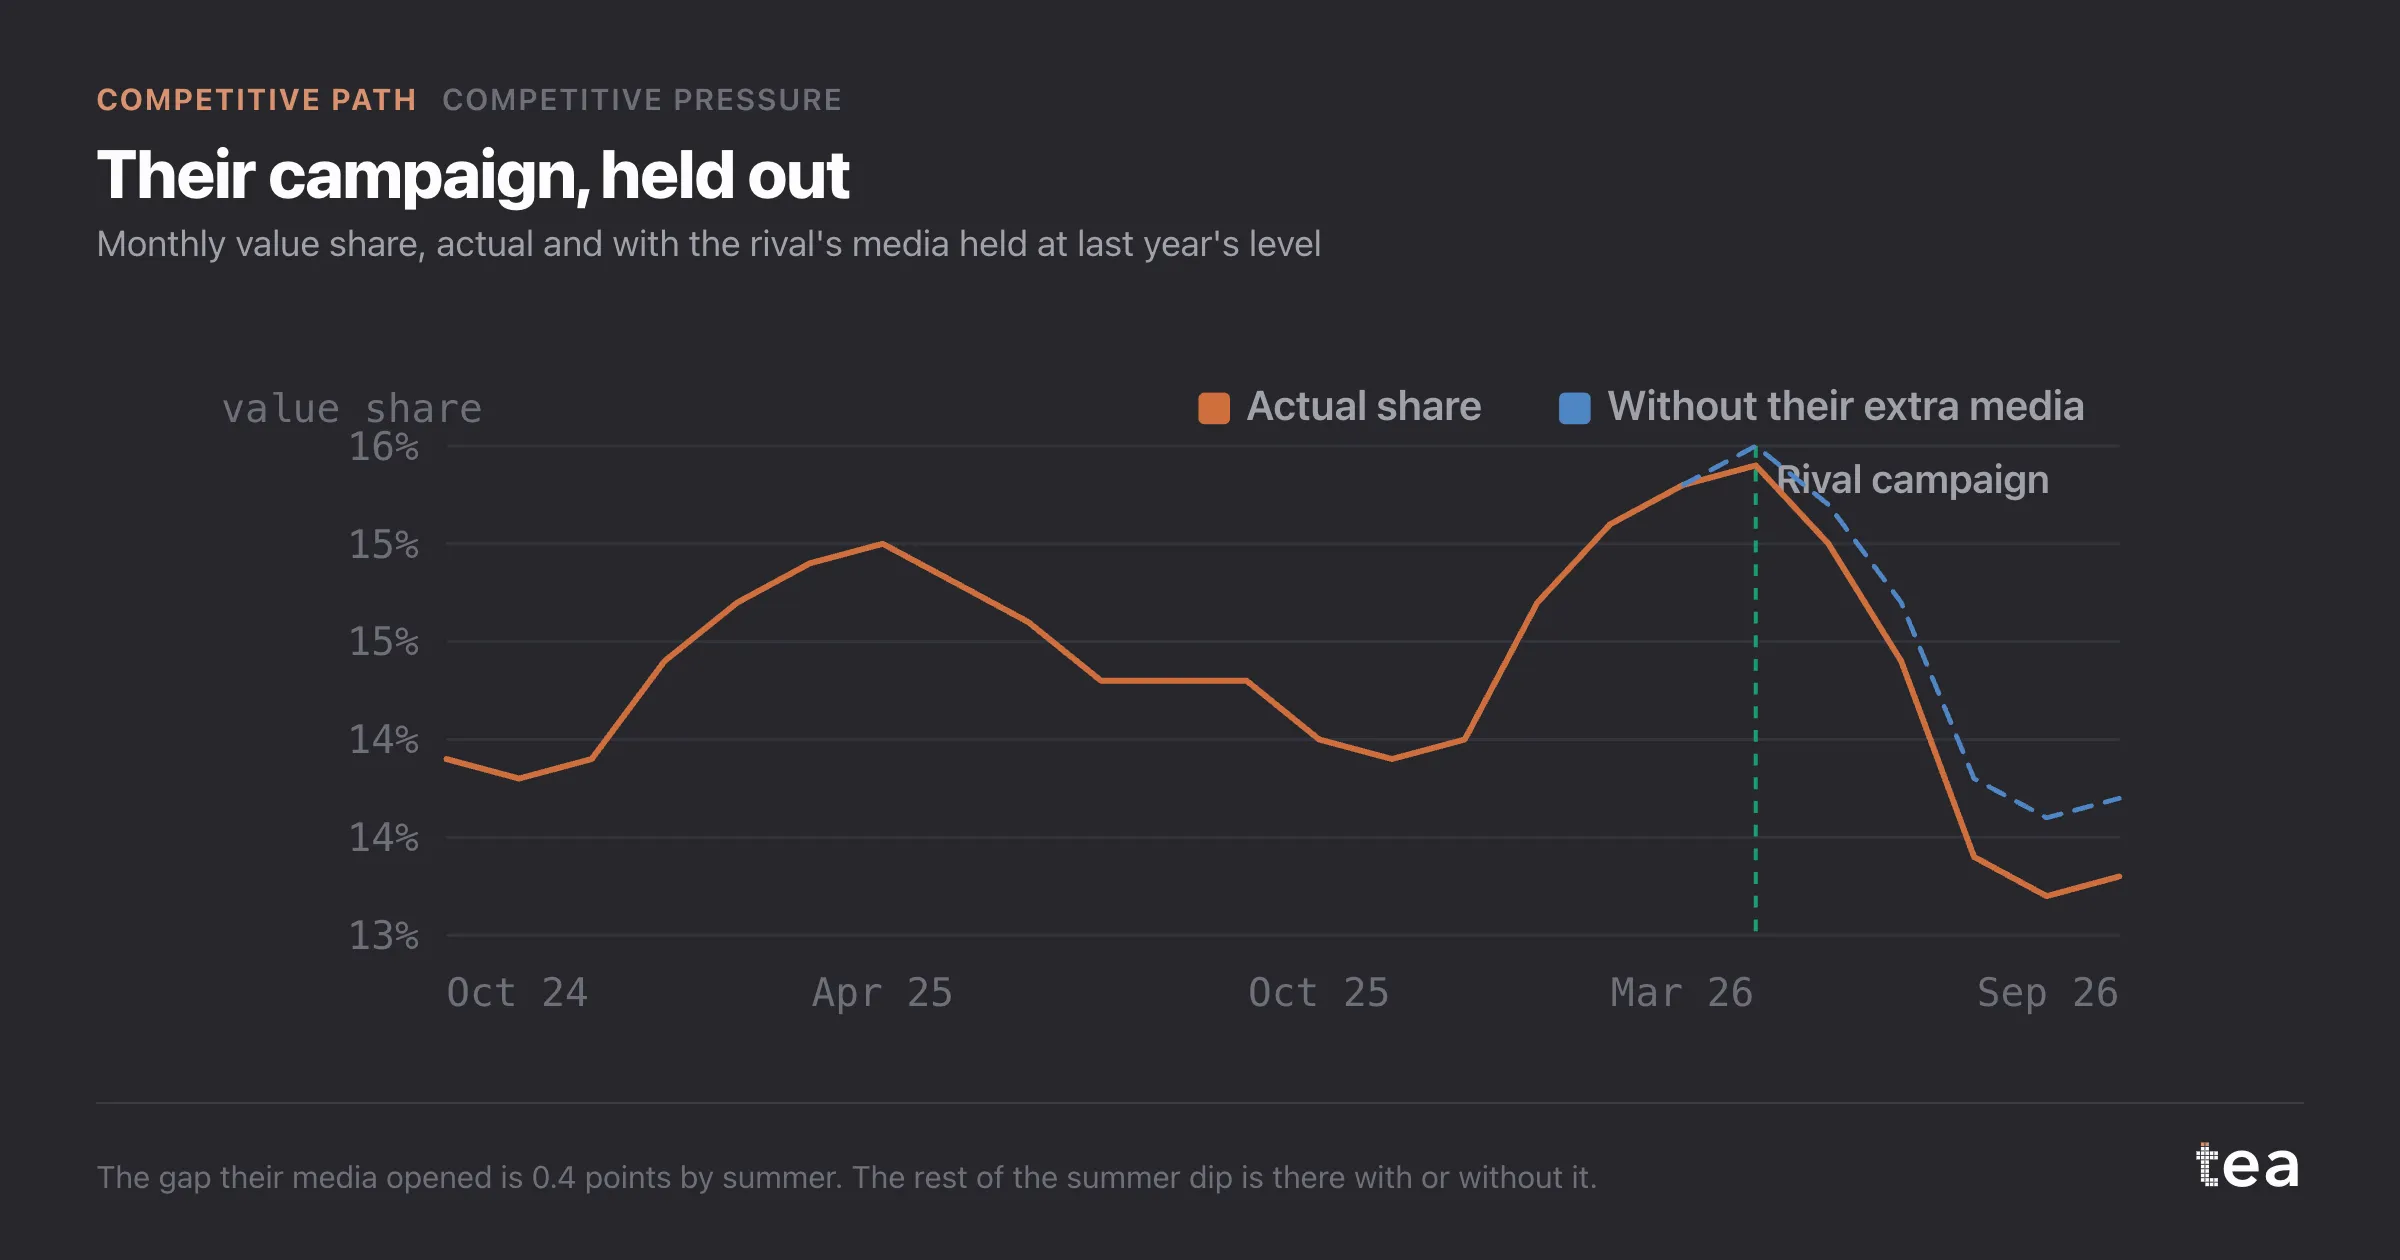
The explanation was in circulation before the data arrived. The main rival had launched a new TV campaign in the spring, the heaviest in the category for three years. The proposal on the table was to answer it with €1.2M of additional TV in the fourth quarter.
The CMO asked something narrower: "Before we spend €1.2M answering their campaign, how much of the point did their campaign actually take?"
What the file looked like
Thirty-six months for five brands, one row per brand per month. Media spend from a monitoring service that, in this category, covers almost all of it: TV, outdoor and online video. Average shelf price per brand from retail panel data. The brand's own promotions, distribution and sales.
The brand also has a seasonal profile the category does not share. Its puppy range peaks in spring, so it sells a larger part of its year in the first half, and its share has a shape of its own with a trough in late summer.
What the analysis did
Competitive Pressure models the brand's share rather than its sales, which takes category-wide movements out of the picture. It then explains the change in share with three groups of drivers, held apart from each other:
- the pressure index, built from everyone's media spend, as in the challenger case;
- the price gap against each rival, with a cross-elasticity on each, the quantity the discount week case measured on its own;
- the brand's own seasonal profile in share, estimated from the two earlier years.
Each driver gets a contribution in share points, with an interval. The comparison was Q3 2026 against Q3 2025, so most of the seasonal shape should cancel. It did not fully cancel, because in 2026 the brand had moved its puppy relaunch from June to April, which pulled volume earlier and deepened the summer trough.
The point split like this:
- Their media: -0.4 points, interval -0.6 to -0.2. The pressure index rose from 104 to 117 once the rival's campaign started. That is real, and it is the largest single part.
- Their price: -0.3 points, interval -0.5 to -0.1. The same rival had quietly cut its shelf price by about 6% on two large bag sizes in May. Nobody had connected it to share, because it arrived in the middle of the campaign.
- Our own season: -0.2 points, interval -0.3 to -0.1. The earlier relaunch moved demand out of the quarter rather than losing it. The first half of 2026 had run 0.3 points above the first half of 2025.
- Unexplained: -0.1 points, interval -0.4 to +0.2. Small and centred near zero, which is what a residual should be.
The verdict: three causes, three answers
The analysis helped, and it changed both the size and the shape of the response.
The media part of the loss supported a smaller media answer. On the fitted relationship, recovering the 0.4 points meant bringing the pressure index back towards 108, roughly €0.5M of additional spend over two quarters rather than €1.2M in one. The brand approved €0.5M.
The price part needed no media at all. The brand reviewed the two bag sizes where the gap had opened, narrowed it by 3% on one and added a multi-buy on the other, at a margin cost below €0.2M a year against an estimated 0.2 to 0.3 points recovered.
The seasonal part needed no answer, only an explanation. It was planned volume arriving earlier. Reporting it as a loss to the rival would have funded a response to something the brand had done to itself.
The rival's campaign did matter. It mattered about 40% as much as everyone had assumed, and the other 60% had causes that more TV would not have touched. The €0.7M not spent on TV is the measurable part of the result. The less measurable part is that the price gap, which would have gone on costing share through the winter, was found at all.
The lesson
A lost share point is almost never one thing. When the explanation arrives before the data, split the loss into their media, their price and your own calendar before you fund the answer, because each part has a different remedy and only one of them is media. That is what the Competitive Path is for: what they did to you, separated from what you did to yourself.
tea, the product
Your file, this question
Fifteen analyses on a CSV of weekly data, with the intervals and the diagnostics shown, and a plain sentence when the data cannot answer. Free while in beta, by invitation.
Request a place in the beta→tea, the product
Fifteen econometric analyses on your own CSV: Competitive Pressure, saturation curves, elasticities, budget allocation. Intervals and diagnostics shown, and a plain sentence when the file cannot answer.
Free while in beta, by invitation.
Request a place in the beta →Liked this? Run it on your own data.
tea runs Competitive Pressure and fourteen other analyses on any weekly CSV, in minutes. Free while in beta, by invitation.
The Competitive Story
- Excess share of voice: where a challenger brand actually gained
- Share of voice when your monitoring service misses digital spend
- Competitor discount week: 2.1% of our volume, not the feared 8%
- A new entrant after ten weeks: too few to measure cross-elasticity
- Should we match a competitor's 25% discount? Lift, margin, hold
- Promotions that always coincide with the rival's cannot be split
- A lost share point, decomposed: their media, their price, our season