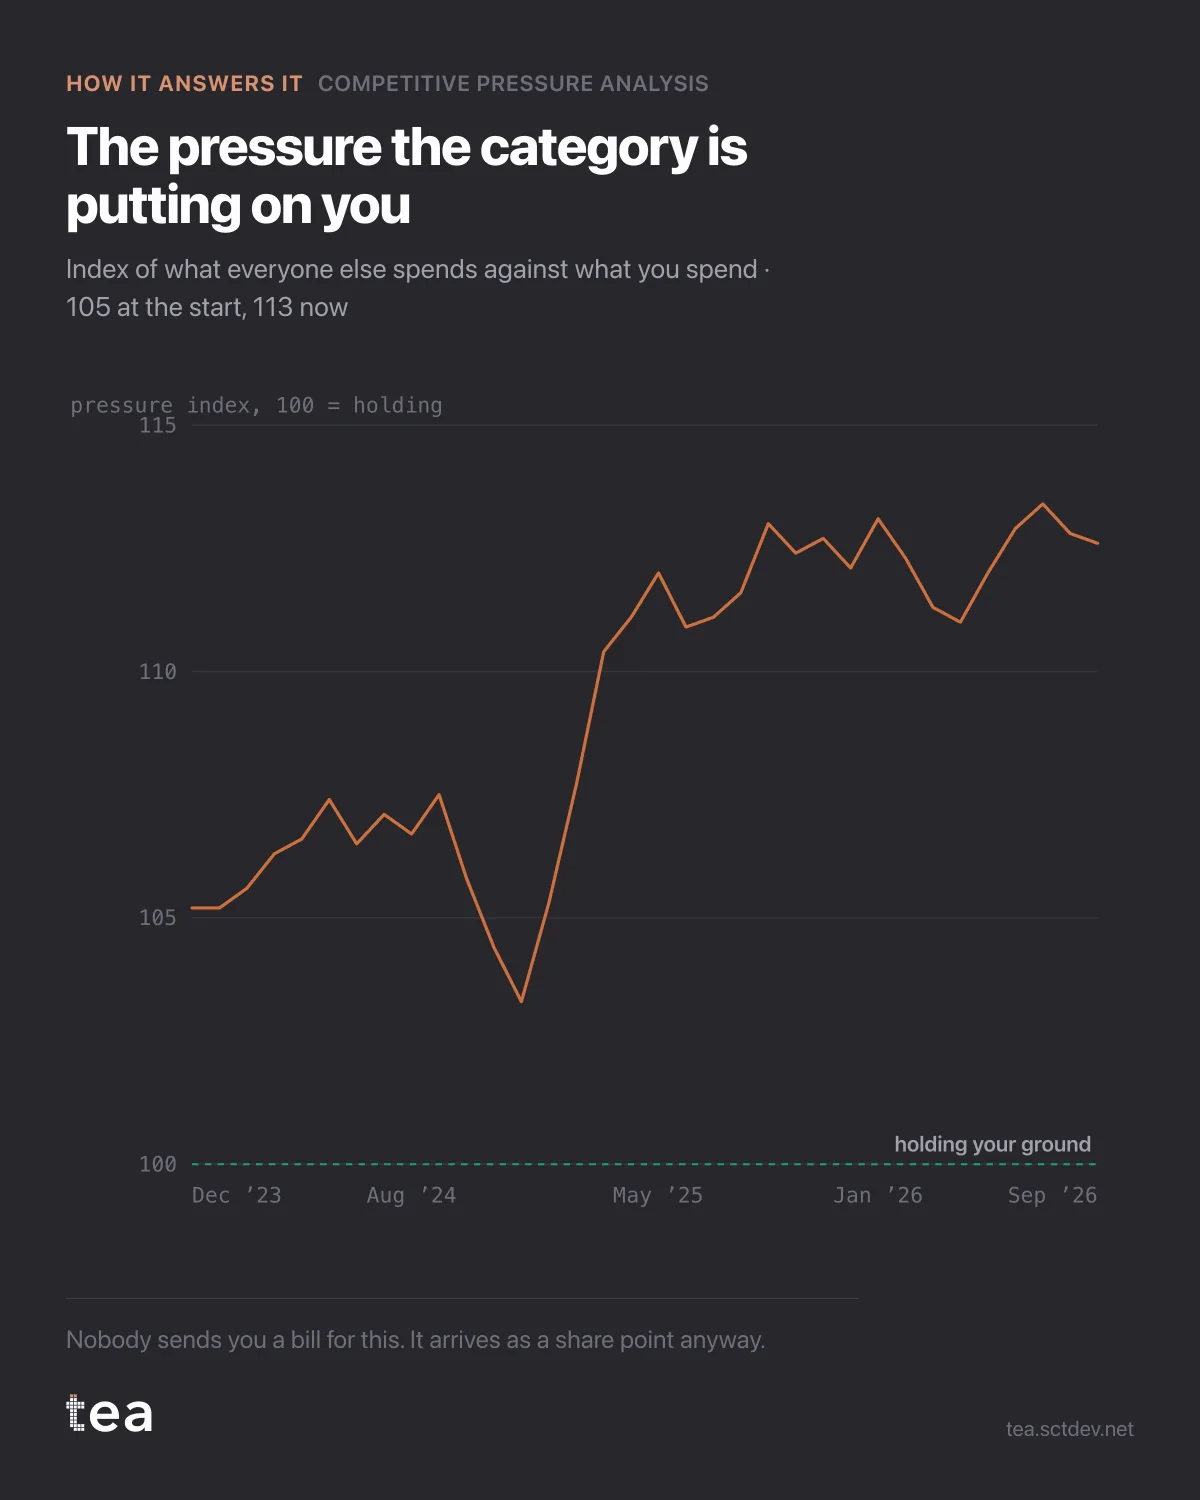
Your competitors increased their spending. Nobody told you, and nobody sent you an invoice. This is what it looks like as a number.
The line is a pressure index: what the rest of the category spends, relative to what you spend, set to 100 at the point where you are holding your ground. It starts at 105 and ends at 113.
Over three years, the cost of standing still went up 13%.
That is the quiet mechanism behind a lot of share loss. Nothing in your own plan changed. Budget flat, creative fine, media efficient. The category simply got louder, and share of voice is a share: it falls when other people spend more, even when your own spend does not move.
What the index is built from, since an index nobody can reconstruct is decoration.
It is your spend against total category spend, month by month, converted into the level you would need in order to hold your current share given the fitted relationship between excess voice and share change. In this file that level is €251,522 against the €118,304 actually spent. Holding position would cost more than twice the current budget.
That number is worth more than any recommendation, because it reframes the whole budget conversation. "We need a bigger budget" is a request. "Holding our share now costs 113% more than we are spending, and here is the fitted relationship it comes from" is an analysis, and the two get very different responses.
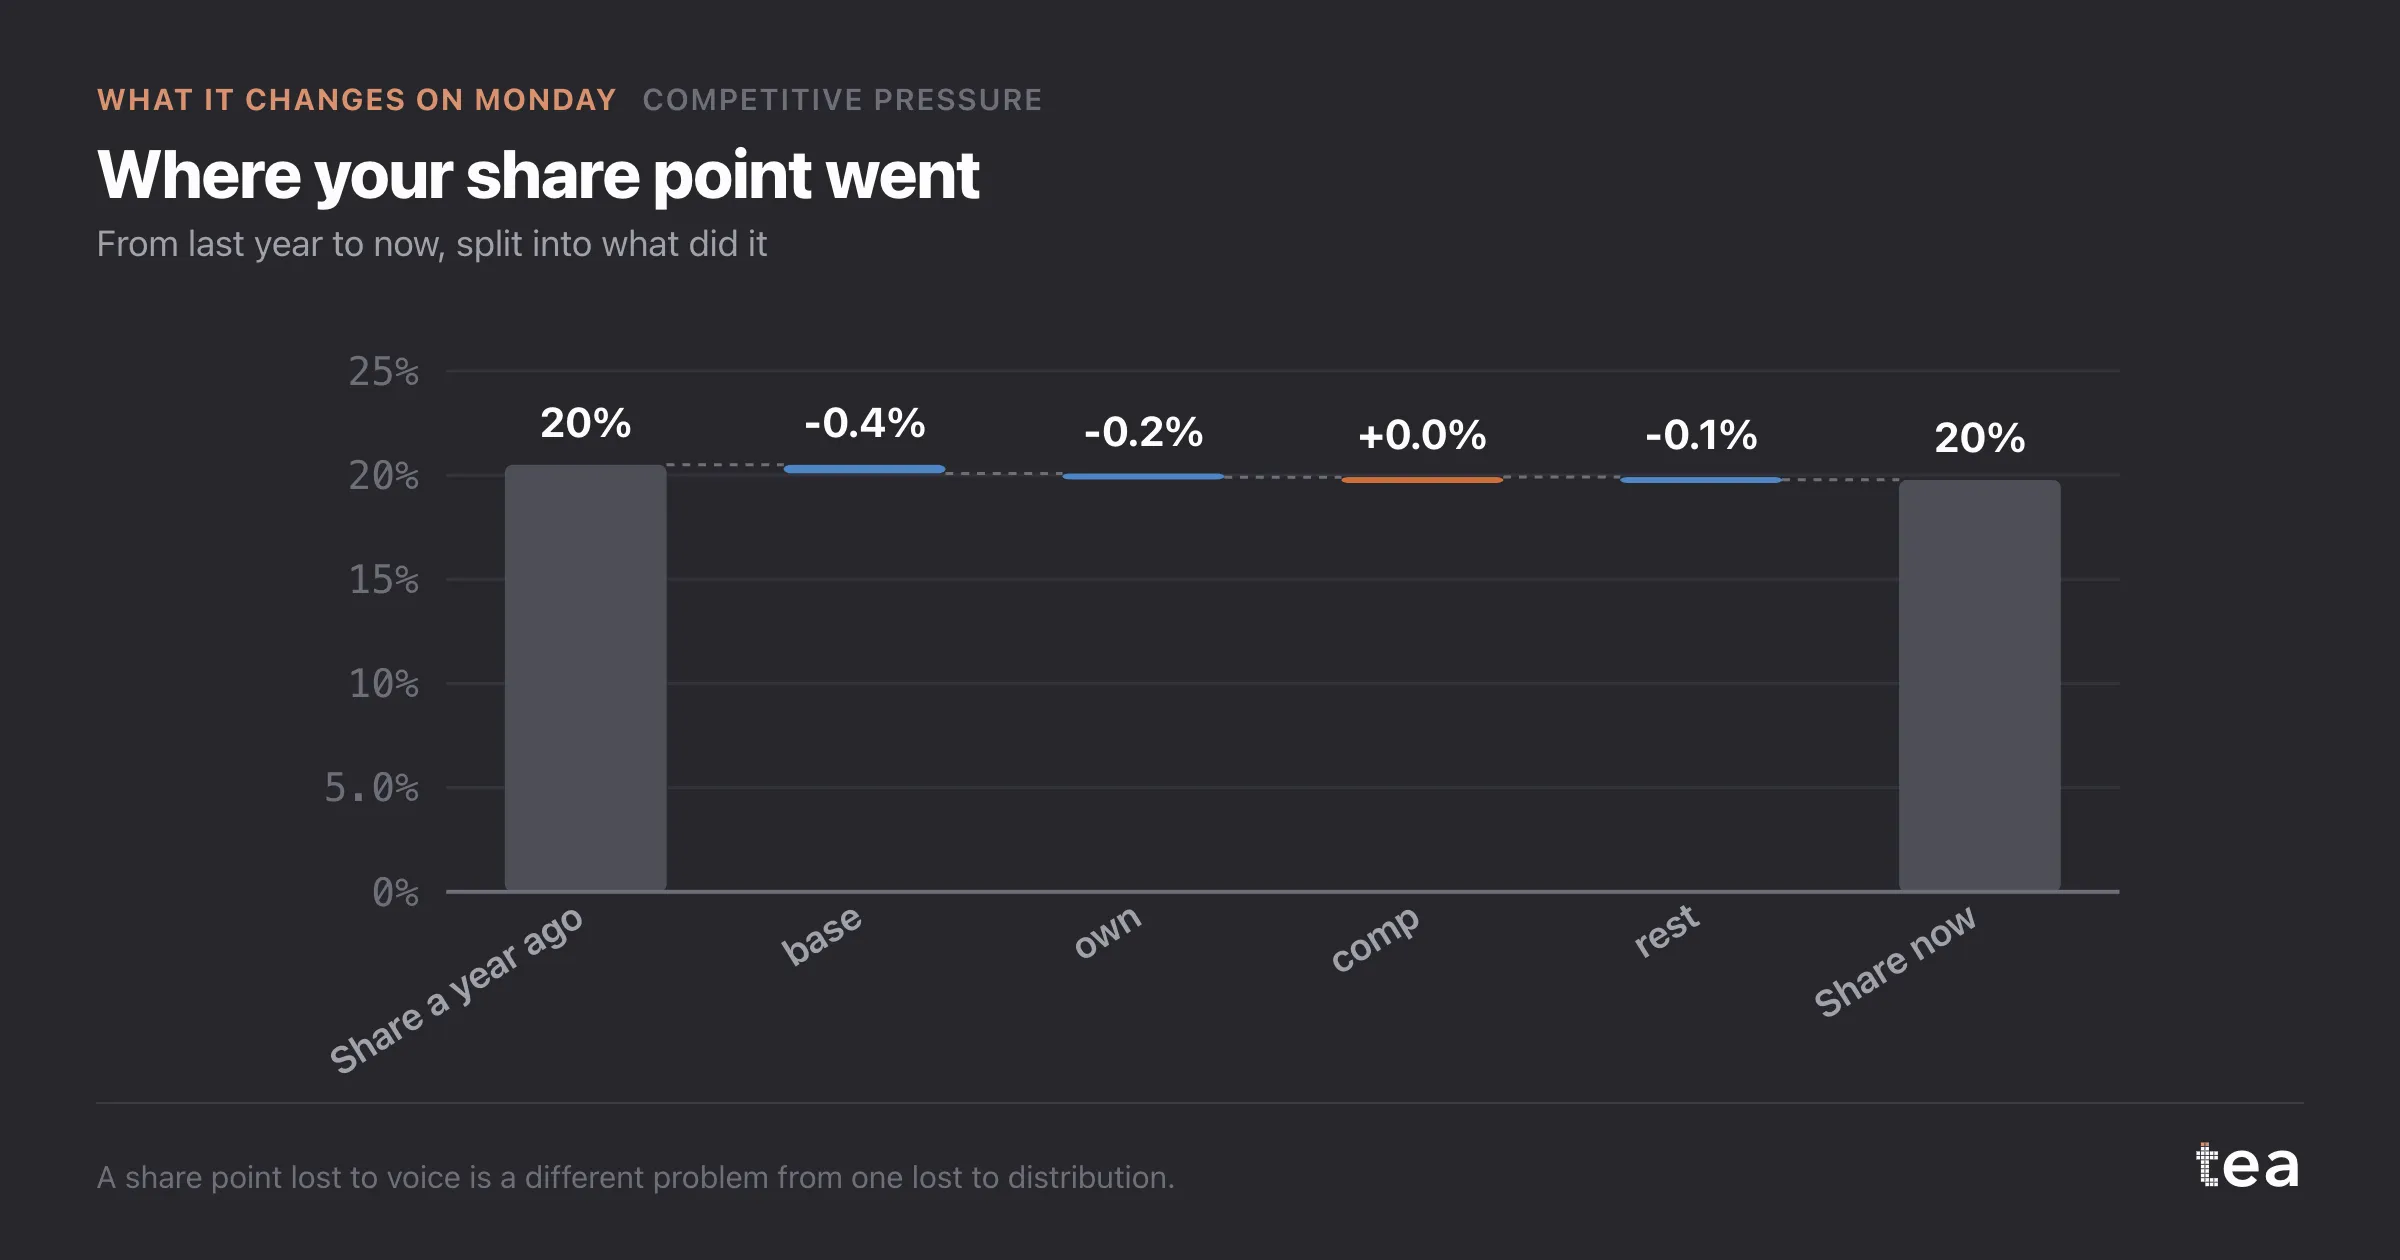
Three honest limits, all of them printed with the result.
Spend data for competitors is estimated, usually from a monitoring provider, and its errors flow into every number here.
The fitted slope is a category average across five brands. Individual brands deviate, and the interval on any single prediction is wide enough to matter.
And voice is not the only thing that moves share. Distribution, pricing and product all sit outside this model, which is why the next chart in the module splits the share change into its parts rather than crediting it all to media.
The habit this supports is a standing view rather than an annual study. Category spend moves monthly, and the cost of holding your position moves with it. A number computed once a year is a number that was true in a market that has since changed.
It also gives planning a vocabulary it usually lacks. "The category got 13% louder" is a sentence a commercial director can act on. "Our share of voice declined" is a sentence that invites a discussion about media buying, which is rarely where the problem started.
The chart is the actual output of Competitive Pressure Analysis in TEA.
tea, the product
Your file, this question
Fifteen analyses on a CSV of weekly data, with the intervals and the diagnostics shown, and a plain sentence when the data cannot answer. Free while in beta, by invitation.
Request a place in the beta→tea, the product
Fifteen econometric analyses on your own CSV: Competitive Pressure, saturation curves, elasticities, budget allocation. Intervals and diagnostics shown, and a plain sentence when the file cannot answer.
Free while in beta, by invitation.
Request a place in the beta →Liked this? Run it on your own data.
tea runs Competitive Pressure and fourteen other analyses on any weekly CSV, in minutes. Free while in beta, by invitation.