ea

Analyses/Competitive Path/Competitive Pressure

What your share of voice really buys.

Competitive Pressure sets every brand’s share of voice against its share of market, and measures how much share a point of excess voice buys in your category instead of taking the rule of thumb on trust. It tells you what holding your share costs, and when the category is quiet enough for your voice to be heard.

Answers Is our share of voice enough to keep our share? Needs Monthly media spend and sales, for every brand Hands back Excess voice, what it buys, spend to hold share

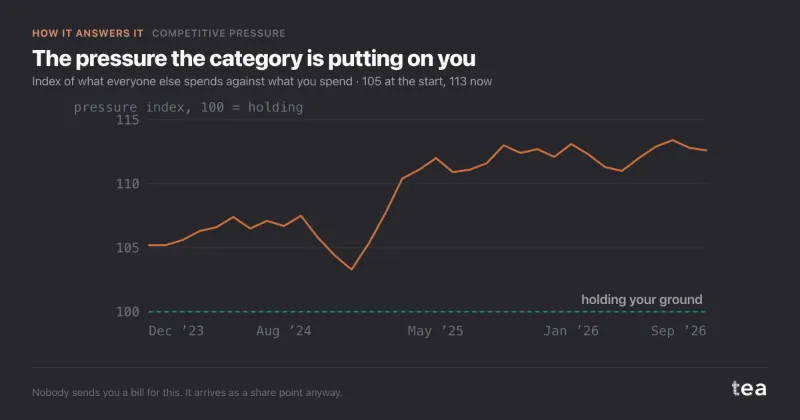
Where the category went quiet

pressure index on the challenger, monthly, 100 = holding your ground
  • Pressure on the challenger
  • Quarters below 95
Excess share of voice+7.9 pts18.4% of voice on 10.5% of market
What a point of it buys0.07 pts a year95% interval 0.03 to 0.11
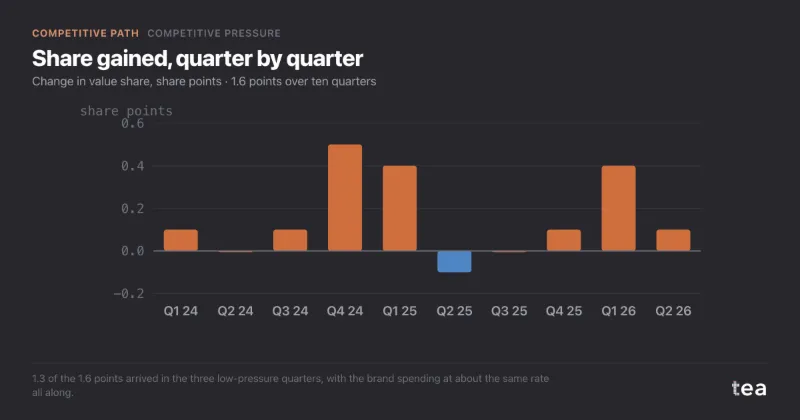
From the three quiet quarters1.3 of 1.6 ptsthe other seven gave 0.3 between them

A German challenger oat drink, from the first example below. A composite case: your file draws its own voice, its own slope and its own quiet months.

01

What it is for

Share of voice is a share: it falls when other brands spend more, even if your own budget does not move. Media spent against a louder category buys less share than the same money in a quiet one, and a budget set without looking at the others is set blind.

Setting a budget against the category

Whether your voice sits above or below your share, how much share a point of the difference buys in your category, and the annual spend that keeps share where it is with competitors as last year.

Phasing the money you have

A flat budget spread evenly buys parity in the months the category is loud. The pressure index shows when it is quiet, which is where a challenger’s share usually comes from.

Answering a competitor’s push

Raise a rival’s spend by a third and see how much share it takes, and what defending it would cost. Then decide knowingly whether to answer, rather than by reflex.

02

How to read it

The page opens on four numbers, all read at last year’s spend, and a sentence that joins them. Read them in this order: where you are, why, where you are heading, and what it costs to stop.

Executive Summary
Our share 19.8%1 Excess share of voice −9.8 pts2 Next 12 months −0.59 pts3 Spend to hold share €252k4

Voice against share

Pressure over time

  1. Our share. Sales as a share of the category, averaged over the last three months, with the change on a year ago: −0.72 points here. A fall of more than 0.3 points is flagged with what it is worth in annual sales.
  2. Excess share of voice. Share of voice minus share of market over the last twelve months: here 10.2% of the category’s media against 20.0% of its sales. Below zero, a brand is selling more than it says, and the category tends to take the difference back.
  3. Next 12 months. The share change the fitted model expects if every brand spends as it did last year, with an 80% range: −0.96 to −0.22 points here. When the whole range sits below zero, the decline is not a matter of luck.
  4. Spend to hold share. The annual media that keeps your share where it is, competitors spending as last year: €252k against €118k actually spent, 113% more. Above half again on last year, the page says holding share by voice alone is expensive and worth weighing against price or distribution.

03

Where it sits in the analysis

Competitive Pressure opens the Competitive Path, the one path that starts outside your own data. It comes first because their media is the cheapest thing to observe and the easiest to over-blame: before asking what their price does, find out how much their voice costs you, month by month.

What you carry forward is the pressure index by period, and a share loss already split into your voice, their voice and what voice does not explain. Cross-Elasticity then asks whether their price takes your volume, and Promo Elasticity what matching a discount would buy.

Before spending more to hold share, Saturation Curves says where your own spend starts to flatten, and the optimiser where that money works hardest.

Competitive Path

  1. Competitive Pressure this page

    What their presence costs you structurally, separated from your own seasonality.

    Carries forward: pressure index, by period

  2. Cross-Elasticity

    Whether their price move takes your volume, and how much of it.

  3. Promo Elasticity

    What matching the discount would actually buy you, at your own measured lift.

04

Where it usually misleads

The arithmetic of share of voice is a division and cannot be wrong. What goes wrong is what is in the column, and what is read into one average.

A denominator from different sources

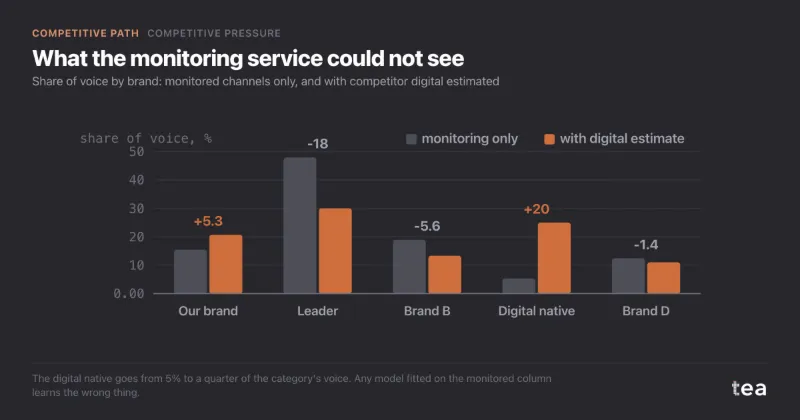
Own spend from finance, competitor spend from a monitoring service that cannot see paid social or search. A mattress brand read 30% of voice that was 15% like for like. The error is largest for digital brands, so the slope learns the wrong lesson too. Second example below.

Fill the spend column the same way for every brand. If competitor digital has to be estimated, run the analysis twice, at the low and the high estimate, and trust only a verdict that survives both.

One average for two and a half years

An excess share of voice of +8 points says the extra voice paid on average. It does not say when. A challenger found most of its gain in three quarters when the leader went quiet, and almost none in the other seven.

The pressure index is drawn month by month beside the averages, and the month your own voice falls a fifth below the year before is marked on it.

The rule of thumb taken on trust

Ten points of excess voice buying a share point a year is an average over other categories. Planned on, it can make a cut look free or a push look certain, and your category never had a say.

The slope is fitted on every brand and every rolling year of your file, with standard errors that allow for the windows overlapping, and the page warns when its interval reaches zero.

Every share move credited to media

A share point can go to a rival’s campaign, a quiet price cut or your own calendar. Read through voice alone, all of it looks like media, and the answer becomes more media.

The share change is split into your voice, competitors’ voice and a step labelled “Not explained by voice”. When that step is more than half the move, the page says to look at price, distribution or product first.

A projection read as a promise

The fitted line says where share goes on average. A single year strays from it, and the coefficient itself is uncertain. A plan that hangs on the central number is planning on one year in two.

The next twelve months come with an 80% range that covers both the coefficient and how far a single year strays, and the simulator draws it as a P10 to P90 band.

Too short a window, too few brands

One year cannot fit a relationship between voice and share, and two brands cannot make a category. With a short file the slope is a guess dressed as a coefficient.

A file with fewer than three brands or fewer than 24 months is declined before the fit, with the reason in plain words.

05

Two examples

One file where the answer changed how the budget was phased, one where the column could not carry an answer at all. Both are useful results.

Helps

A challenger that gained when the category went quiet

A challenger oat drink in Germany, about €31M a year in a €280M category, six brands. Over thirty months it averaged 18.4% of the category’s voice on a 10.5% value share, an excess of about 8 points, and its share rose from 9.6% to 11.2%. The fitted slope was 0.07 share points a year per point of excess voice, with a 95% interval from 0.03 to 0.11.

The pressure index sat between 106 and 114 most of the time and dropped below 95 in three quarters. Those three quarters produced 1.3 of the 1.6 points gained. The total budget stayed flat, and about 35% of it moved into the windows where pressure has dipped. The re-phased plan projected 0.4 points over the next year against 0.2 for the even one, around €560,000 of retail sales for the fifth of a point.

Read the full case

Share gained, quarter by quarter

change in value share, points
  • Quarters with pressure below 95
  • The other seven

The brand spent at about the same rate all along. Where the category was loud, the money bought parity.
Does not help

A share of voice that changed sign with its source

A UK mattress brand, about £38M a year and 17% of its category, asked whether a 30% share of voice meant it could cut £1M. Its own £6.2M came from finance, 58% of it digital. The four competitors’ £14.3M came from a monitoring service that sees TV, radio, press, outdoor and cinema, and none of paid social or search.

Three honest ways to fill the column gave three answers: +13.2 points of excess voice as delivered, −1.6 offline only, +3.7 with competitor digital estimated, somewhere between 1.2 and 6.4. The share-change model was not run, because it would have learnt from the same broken column for every brand. The brand cut £300k instead of £1M, in two regions, as a test.

Read the full case

One brand, three excess shares of voice

share of voice minus 17% share of market, points

Own full spend against competitors’ monitored spend says cut. Like for like says hold. The answer changes sign with the source.

06

What the charts add to the numbers

An excess share of voice is one number per brand, and one number invites the rule of thumb. Each chart replaces a piece of the rule with your own category: what voice buys here, what next year looks like, and why share moved last year.

What excess voice buys

every brand over every rolling year, share points
  • Our brand, each rolling year
  • Competitors
  • Fitted
  • 90% of years fall here

Reads as: what a point of excess voice is worth in share, in this category rather than on a conference slide. Here ten points buy about 0.6 share points a year. The band is the honest part: a single year can sit well away from the line, so a plan should survive the edge of the band, not only its middle.

Why our share moved

last year’s change, share points

Reads as: how much of last year’s loss was already baked in by where our voice stood, how much our own cut added, how much the competitors did, and what voice does not explain. Here the category barely moved: most of the 0.73 points came from our own voice. It is the chart that stops a meeting from blaming the competition for a decision taken in-house.

Response simulator

our share, last 24 months and the next 12, restoring our voice by 60%
  • Our share
  • As last year
  • Voice up 60%
  • P10 to P90

Reads as: next year’s share under a spend plan for you and for every competitor, against business as usual, with the range that says how sure the model is. Here even 60% more voice does not hold the share: it ends at 19.26% against 18.95%, and holding it would take €252k a year, 113% more than last year. Every brand’s gain is someone else’s loss, because shares are rescaled to add up to 100.

tea, the product

Find out what your share of voice really buys

A CSV with a date, a brand, sales and media spend. The voice-to-share slope for your category, the pressure month by month, and the spend that holds your share. Free while in beta, by invitation.

Request a place in the beta

tea, the product

Fifteen econometric analyses on your own CSV: Competitive Pressure, saturation curves, elasticities, budget allocation. The diagnostics shown, and a plain sentence when the file cannot answer.

Free while in beta, by invitation.

Request a place in the beta →

Now run it on your own data.

tea runs Competitive Pressure and fourteen other analyses on any weekly CSV, in minutes. Free while in beta, by invitation.

Join the beta