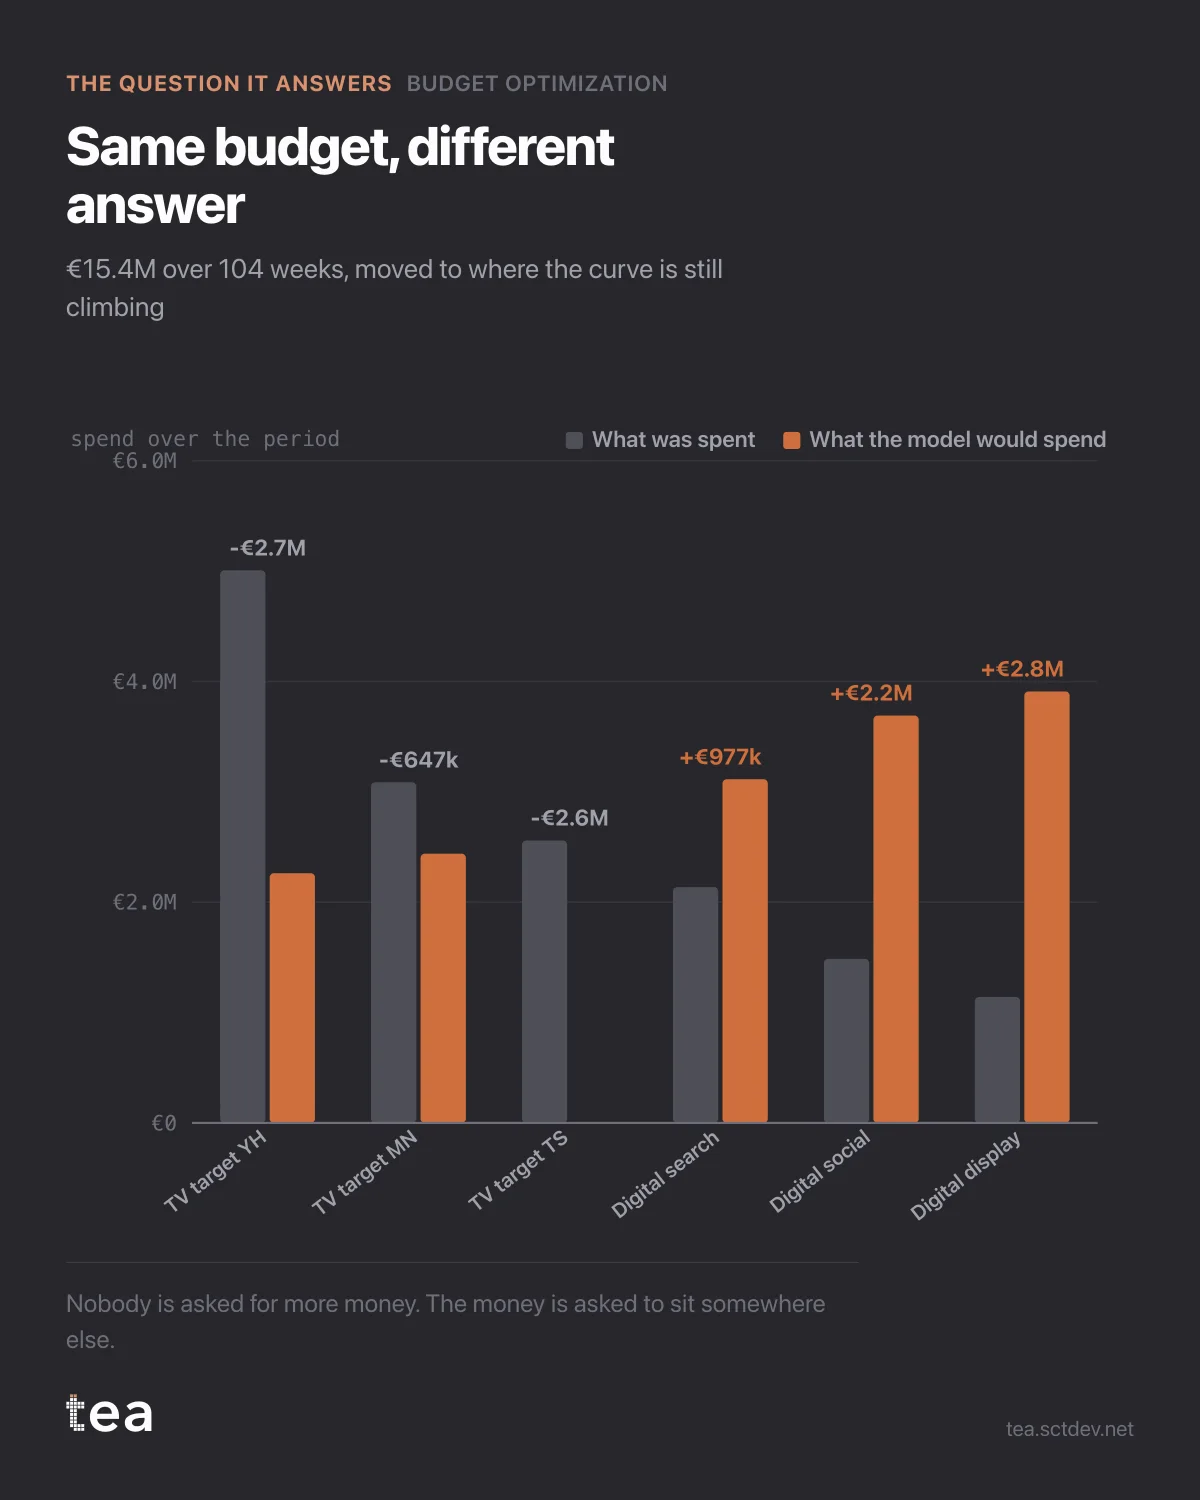
Same budget. Different answer. €15.4M over two years, and nobody is being asked for more money.
Grey is what was spent. Terracotta is what the model would spend, on the same total, given what it learned about each channel's response curve.
The moves are not small. Two of the three TV targets lose €3.4M between them. One loses its entire budget. Digital display more than triples, digital social more than doubles, digital search gains a million.
The modelled uplift is 28.8%.
Before that number gets quoted anywhere, three things about how to read it.
It is uplift on modelled revenue, not on the whole business. The model attributes 45% of observed revenue to the drivers it contains. The rest is structural, and no reallocation touches it.
It assumes the response curves hold at the new levels. Tripling a channel moves it into a region of its curve that has less data behind it, which is exactly where a fitted shape is least reliable. That is a real limit, and it is why the recommendation comes with a conservative variant.
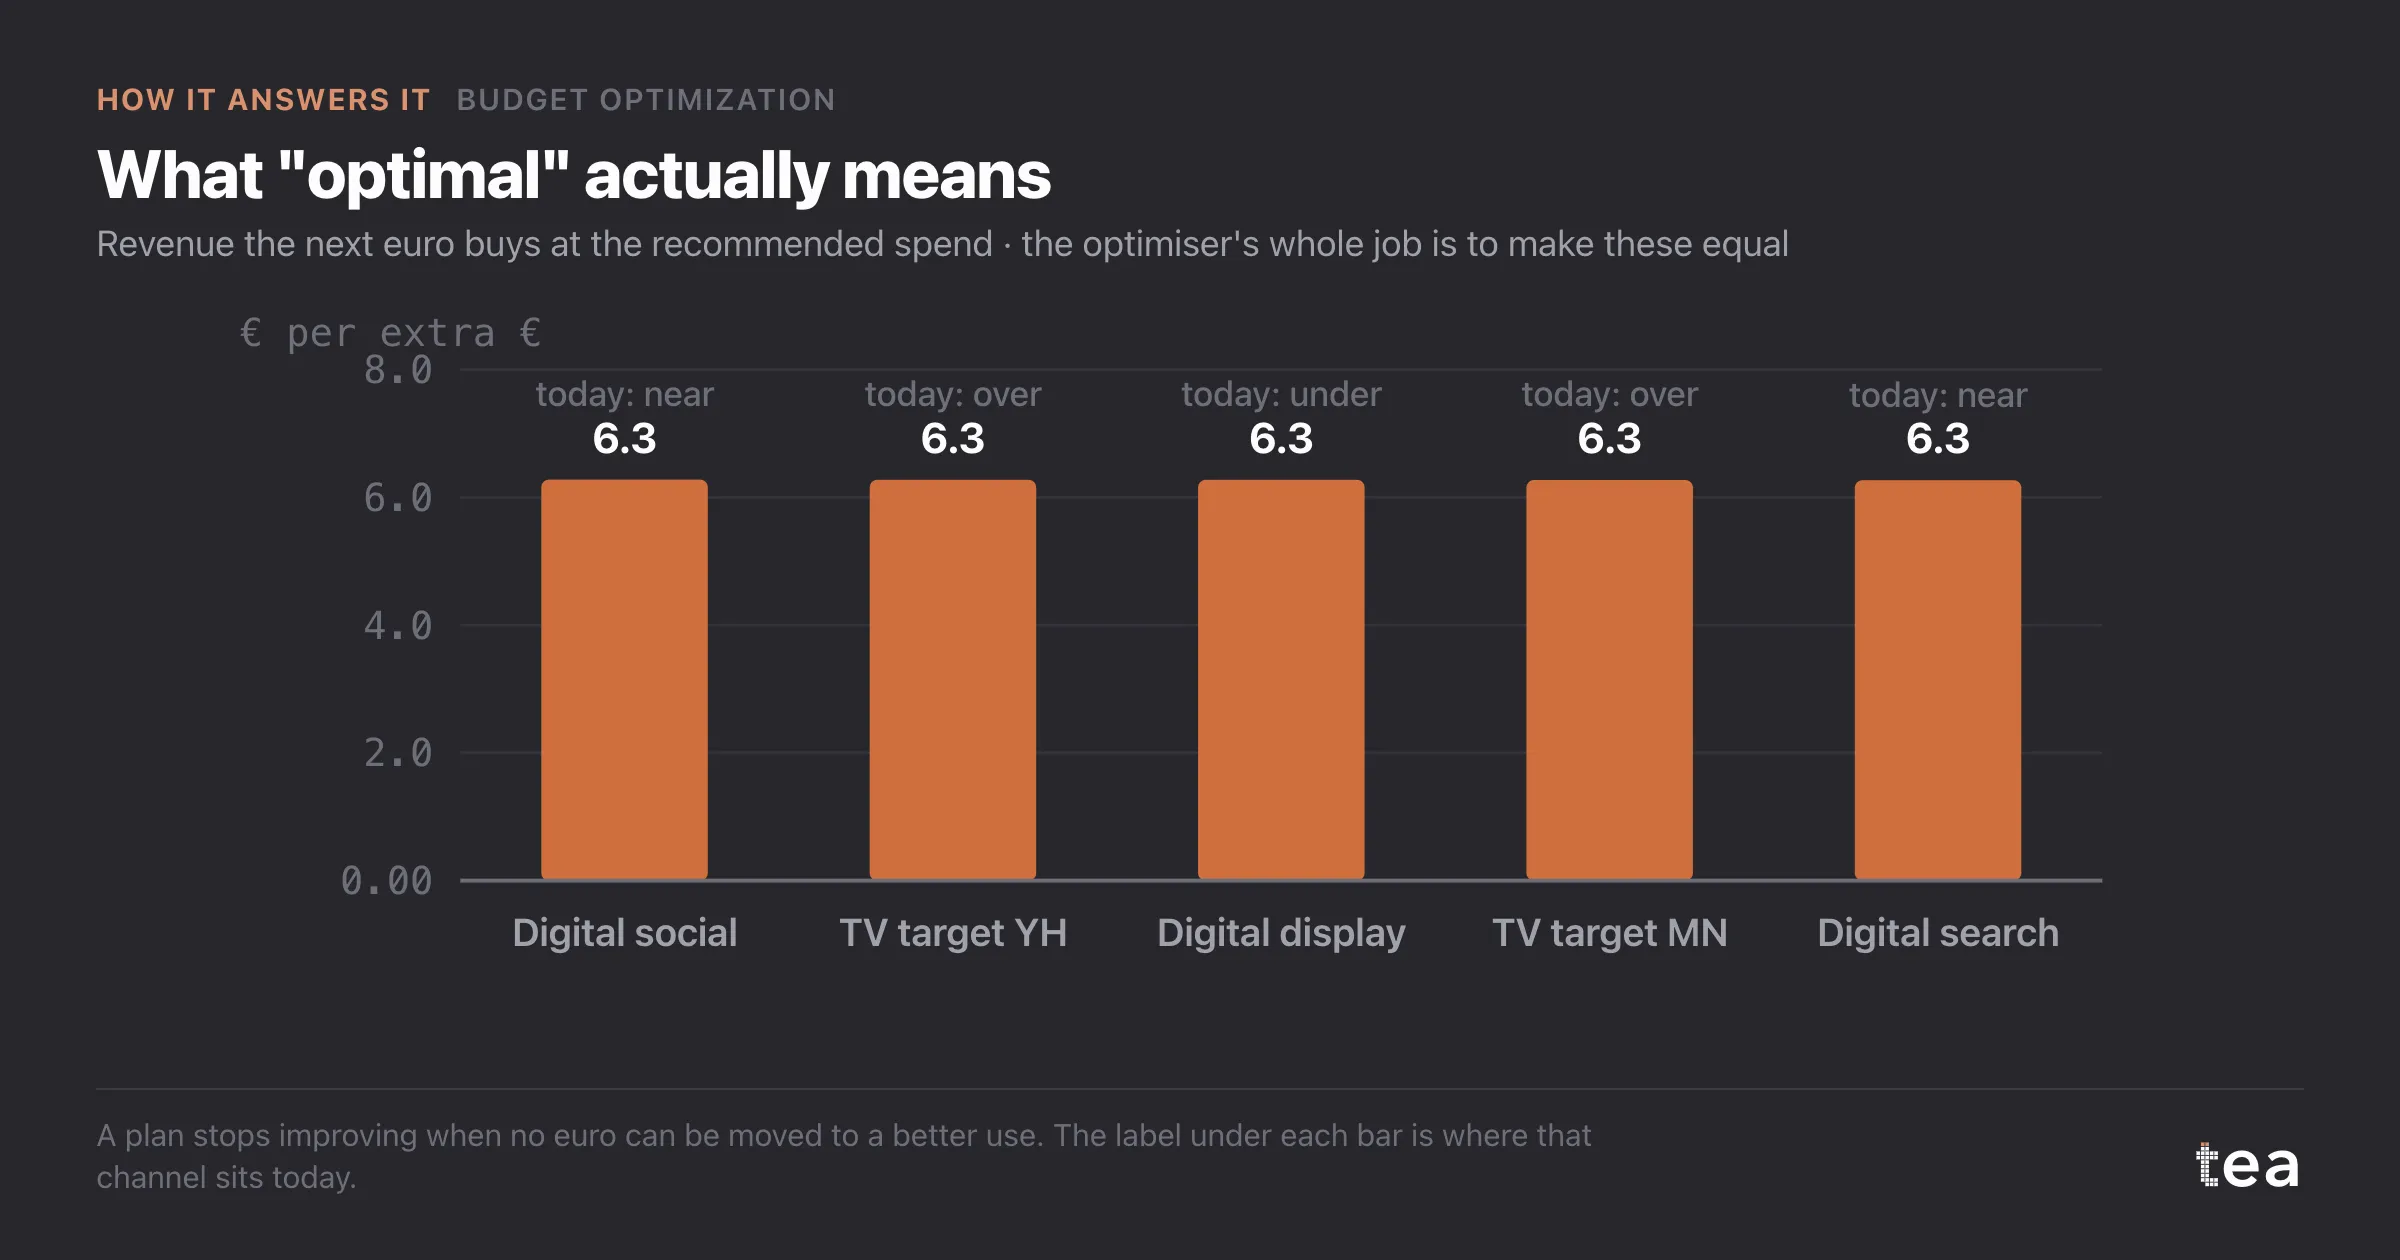
And one channel was dropped rather than shrunk. Its fitted coefficient is not positive, so the optimiser refuses to fund it. The honest reading of that is not "this channel does nothing", it is "on this data, jointly estimated, the model finds no payoff", and with correlated channels those are different statements. The product prints the second one.
What makes this exercise worth doing is not the 28.8%. It is that the plan has been made to explain itself. Every euro moved has a curve behind it, a marginal return attached, and a note saying how much confidence that specific move deserves.
A plan built this way survives the question "why is TV down €3.4M" with an answer rather than a position.
Something worth noticing in the shape of the recommendation: it is not a purge. Three channels keep most of their money, two grow, one goes to zero. Optimisers get a reputation for radical answers because they are usually run without constraints, and an unconstrained optimum will happily put the entire budget into whichever curve looks steepest.
The constrained version is the one that gets executed. It keeps reach where reach is needed, moves the money that can be moved, and leaves the argument about the last channel to people rather than to the solver.
There is also a timing question this chart does not answer. It says how much, not when, and a plan that moves €2.8M into display should still respect the flighting, the lead times and the carryover of everything it is moving away from.
The chart is the actual output of Budget Optimization in TEA, run on a sample file anyone can download.