ea

Analyses/Media Effectiveness Path/Budget Optimization

The same budget, moved to where it returns.

Budget Optimization fits one response curve per channel, jointly, and moves the same total until the next euro returns the same in every channel. The plan is only as good as the curves it stands on, and the result says which of them it had to assume.

Answers Where should the same budget sit next quarter? Needs Weekly KPI and spend per channel that moves Hands back Allocation, marginal return, three budget levels

The next euro, before the move and a quarter after

revenue per extra euro, by channel
  • Before the move
  • A quarter later, refitted
Moved€410kof a €2.4M quarter, into social and video
Gap between channels€1.10best to worst next euro, from €2.30
Read a quarter later2.6%against 3.1% planned, 5.8% recommended

The pet-food brand of the first example below. A composite case: on your file each channel has its own curve, and the plan is read from them.

01

What it is for

A media plan is usually last year’s plan, adjusted. An optimiser asks a different question: where does the next euro buy most, and keeps moving money until the answer is the same everywhere.

Reallocating a flat budget

When the total is fixed, moving it is the only lever. Equal marginal returns says which way each channel should go, and roughly how far, before the plan is written.

Explaining a cut

A channel cut on instinct is a position. A channel cut because its next euro returns €0.90 while another returns €3.20 is an argument that survives the meeting, and can be checked a quarter later.

Pricing a change in the total

The same curves price the optimum at 20% less and 20% more budget. What a cut costs, or what an increase buys, has a number before the budget round.

02

How to read it

Every channel has a card in the Saturation curves block: a verdict, two numbers and its curve with two dots on it. The distance between the dots is the recommendation.

Online video Near saturation1
½-sat ≈ €32k/wk2 Now €23k/wk3

Saturation curve

  1. The verdict. Under-saturated, near saturation or over-saturated, judged on what the channel runs at today against its half-saturation point: above it is over, above 70% of it is near. It is judged on today, not on the plan, so it does not change while you drag.
  2. Half-saturation. The weekly spend at which the channel delivers half of its ceiling, from the curve fitted on your file. It is the dashed line on the chart. Past it, each euro buys clearly less than the one before.
  3. Now. What the channel runs at in a typical week of the file, the filled dot. The hollow dot marked opt. is where the plan puts it. When the hollow dot sits far past any week the channel has run, the plan is reading a part of the curve nobody has seen.

03

Where it sits in the analysis

Budget Optimization closes the Media Effectiveness Path, the step where the path becomes a plan. It comes last because it is arithmetic on everything above it: the memory of each channel, the bend of each curve and the share each one earned. In tea it fits them again in one model, adstock and saturation per channel together, so the contributions it moves add up.

It does not hand a number to another step. It hands back a plan to test: an allocation, a marginal return per channel and three budget levels. Before that plan reaches a meeting, the result sends you back up the path, to the curve behind each move and to what the channels have actually contributed.

What the module hands back is set out on the budget allocation page. This one is about reading it, and about the plans it should not be trusted with.

Media Effectiveness Path

  1. Lag & Carryover

    Finds how long a burst keeps working, before anyone tries to measure how big it was.

  2. Saturation Curves

    Where each channel stops paying back, fitted as a curve rather than asserted as a rule of thumb.

  3. Contribution & Driver Decomposition

    What each channel actually contributed across the window, adstock and saturation included.

  4. Budget Optimization this page

    The same budget, moved. With the conservative scenario for when the plan meets reality.

  5. Geo / Segment MMM optional

    The same model per region or segment, if your file carries one. Where the average hides two different markets.

04

Where it usually misleads

An optimiser never hesitates. It moves money wherever the curves say, including places the file has never been, and it knows nothing about contracts.

The edge of the file read as an opportunity

Up to the highest week ever bought, a response curve is data. Past it, the formula extends itself, and the optimiser reads the central line with the same confidence everywhere. A plan that puts 60% of the budget in one channel is usually finding where the file ends. Second example below.

Each channel’s card draws today’s spend and the plan’s spend on the same curve. When the second dot sits past anything the channel has run, take the move as a test: a step up, then a refit.

Money that cannot move

An upfront TV deal, a year-long outdoor contract, a floor on presence during a launch. None of them is in the file, so the optimiser cuts them as freely as anything else, and the plan’s savings are imaginary while its additions are real.

Switch to Micro tuning and drag a contracted channel back to its committed level: the other channels absorb the difference, and the uplift is recomputed on the same curves.

A curve that was assumed, not fitted

A channel bought at one steady level has no curve to find. An assumed shape puts it at its own half-saturation point by construction, and what is left to tell channels apart is their coefficient: a ranking dressed as a saturation analysis.

Channels on an assumed curve are named under About this plan, and the run can be set to return no plan at all unless every curve came from the file.

A channel the model cannot see, cut to zero

Two channels booked in the same weeks trade credit, and one can come out of the fit with an effect that is not positive. “On this data, the model finds no payoff” is a different sentence from “this channel does nothing”.

Such a channel is not funded, stays on the page as Not funded with its reason, and comes with a note to check the decomposition’s collinearity before cutting a budget on it.

Uplift read on the whole business

A 28.8% uplift sounds like a different company. In that sample it was uplift on the revenue the model attributes to media, 45% of what was observed. The rest of the business does not move with any reallocation.

The headline and the Current response card both say media-driven revenue, and the uplift is a share of that, not of sales.

The biggest number quoted as the target

A recommended 5.8% gets quoted, remembered and missed. Executed in one jump, a plan also leaves no way to tell a wrong curve from a bad quarter.

The Scenarios table prices the optimum at 20% less and 20% more budget beside the recommended one. Plan on part of the move, refit with the new weeks, then take the next step.

05

Two examples

One plan that was executed in a step and read afterwards, one that should not have been taken. The same optimiser produced both.

Helps

A reallocation read a quarter later

A pet-food brand in German grocery and online, €9.6M of media a year across five channels and a flat budget for next year. In 130 weeks every channel had moved over a wide range. At current spend the next euro returned €3.20 in social and €0.90 in search: a spread that wide means money in the wrong places.

The recommended plan projected 5.8% on modelled revenue. The team executed a smaller version in one quarter, planned at 3.1%: €410k of €2.4M moved out of search, outdoor and TV into social and online video. Refitted with 13 new weeks, it came back at 2.6%, an interval from 0.8% to 4.4%, and the gap between best and worst channel had fallen from €2.30 to €1.10.

What was promised, and what came back

uplift on modelled revenue, first quarter

The reading came in under the plan that ran, inside its interval of 0.8% to 4.4%, and far under the headline.
Does not help

Sixty per cent into one channel

A consumer electronics retailer in the Netherlands, €6.2M of media a year. Run with nothing locked, the optimiser took online video from €1.2M to €3.72M, 60% of the budget, cut TV, outdoor and radio hard, and projected 17.6% on the same total.

Online video had run at nine weekly levels, all between €20k and €45k. The plan asked for about €72k a week, 60% above the highest week ever bought, where the curve’s band widens from about 8% either side to 28%. And €3.1M of TV and outdoor was under contract. With those locked and every move capped, the plan moved €360k for 3.4%, 1.9% on the cautious side of the curves.

The plan the optimiser wanted

annual spend by channel, €6.2M in all
  • What was spent
  • Unconstrained recommendation

Half of this budget was under contract, and the online video line sits past every week the file has seen.

06

What the charts add to the numbers

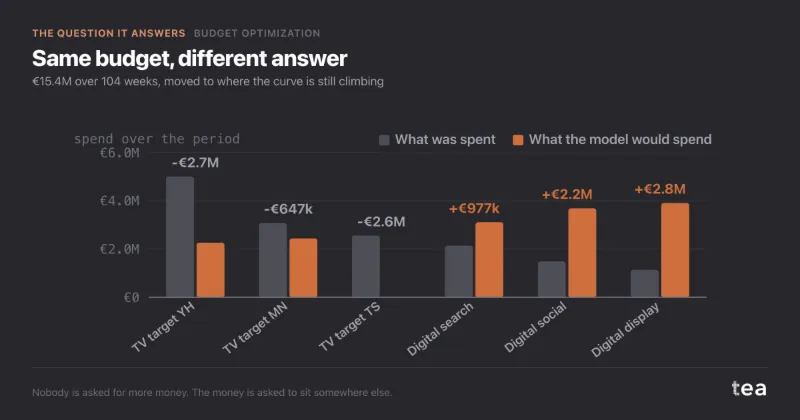
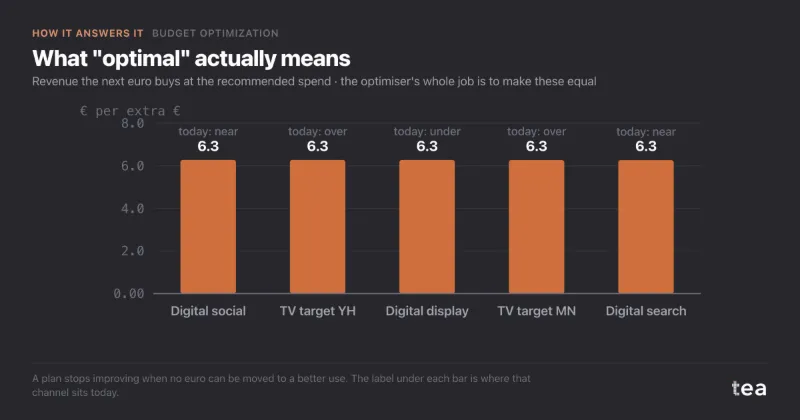
An allocation is a list of numbers, and a list invites the question “why”. Each chart answers it from a different side: whether the plan is finished, which moves carry it, and how far it goes from today.

Marginal ROI by channel

revenue per extra euro at optimised spend, sample market
  • Over-saturated
  • Near saturation
  • Under-saturated

Reads as: whether the plan is finished. At the optimum the bars are the same length, because a euro still has somewhere better to go while one channel returns more on its next euro than another. The colour is where each channel sits today: the over-saturated ones are where the money came from.

Revenue impact by channel

gain and loss from the move, € a year, sample market

Reads as: which moves carry the plan. One or two bars usually do most of the work. A plan whose gain rests on a single channel rests on that channel’s curve, so that is the curve to open before the meeting.

Allocation: current vs optimised

annual spend per channel, sample market
  • Current
  • Optimised

Reads as: how far the plan goes from today, channel by channel, on the same total. A line that doubles or empties is a move to stage over quarters rather than to sign at once, because the distance between two bars is also the distance from the spend the curve was fitted on.

tea, the product

Find out what the same budget could do

A CSV with a date, a KPI and the spend per channel. The allocation, the marginal return of every channel and the notes on what the plan cannot see, in minutes. Free while in beta, by invitation.

Request a place in the beta

tea, the product

Fifteen econometric analyses on your own CSV: Budget Optimization, saturation curves, elasticities, budget allocation. The diagnostics shown, and a plain sentence when the file cannot answer.

Free while in beta, by invitation.

Request a place in the beta →

Now run it on your own data.

tea runs Budget Optimization and fourteen other analyses on any weekly CSV, in minutes. Free while in beta, by invitation.

Join the beta