The year you would have had anyway.
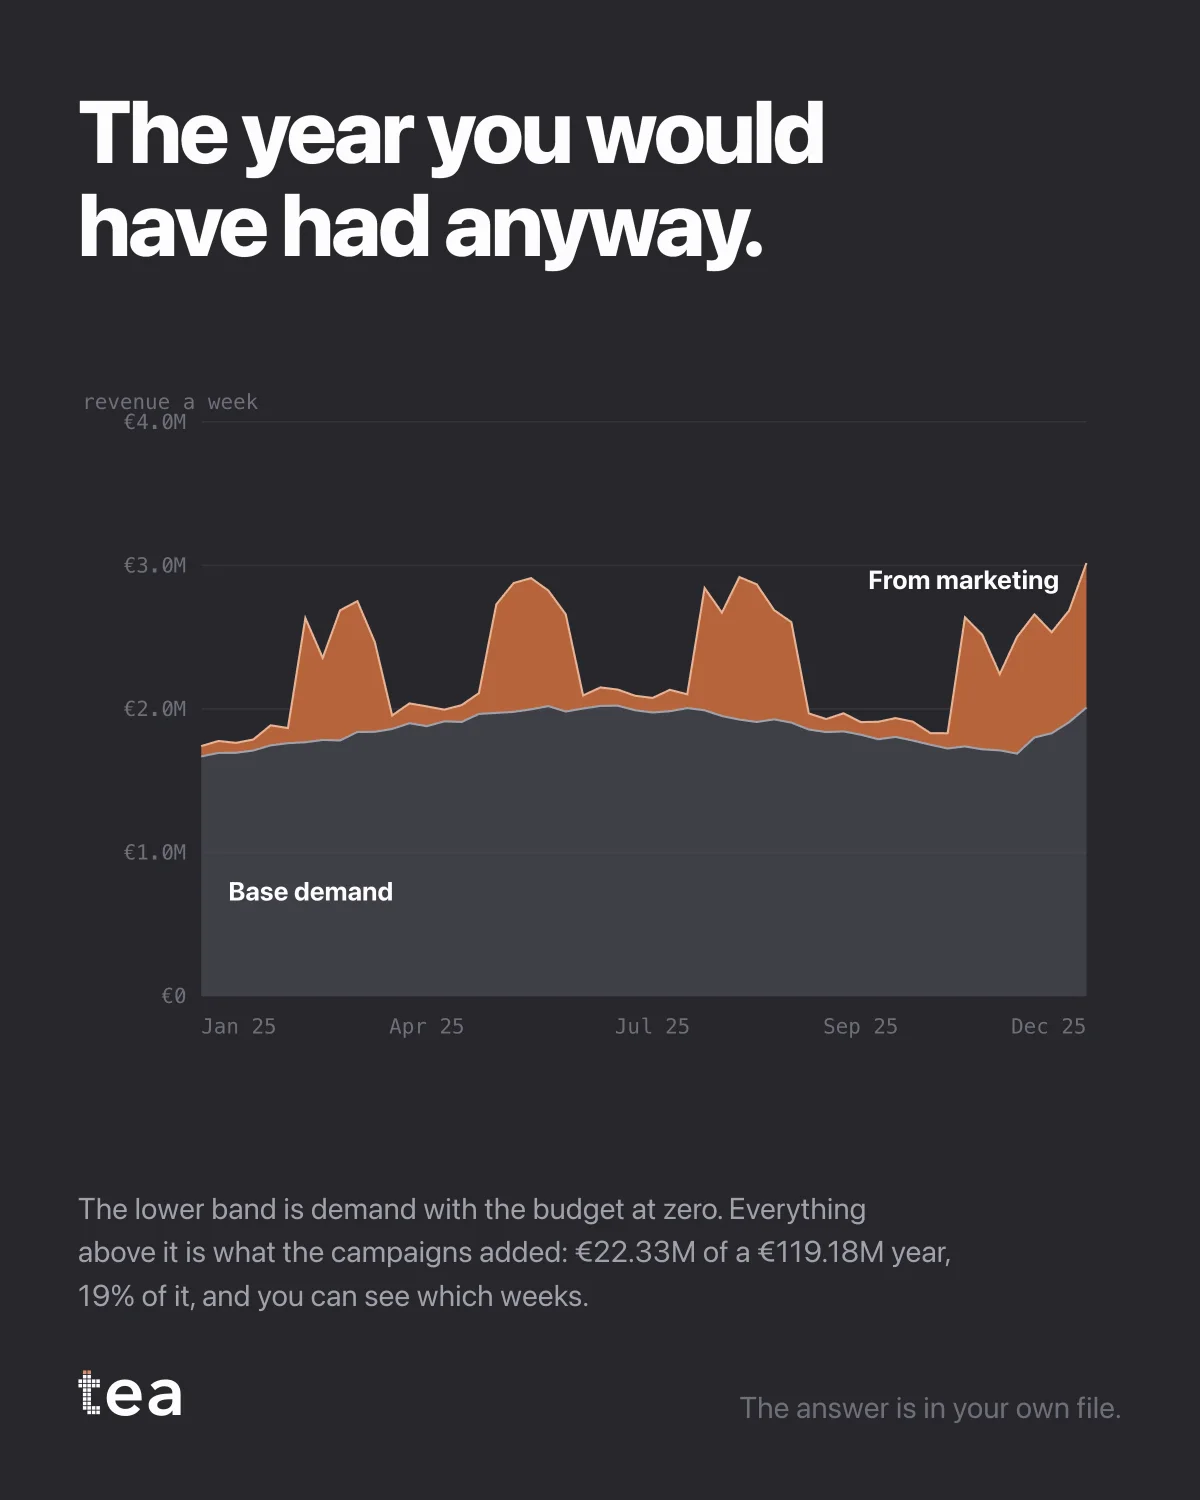
Two bands, fifty-two weeks. The lower one is demand with the marketing budget at zero. Everything above it is what the campaigns added: €22.33M of a €119.18M year, 19% of it, week by week.
This is the chart I would put in front of a board before any other, and it is the one most businesses do not have.
Here is why it is uncomfortable in both directions, which is usually the sign of an honest number.
For marketing, 19% is smaller than the story the annual review tells. The plan did not deliver the year. It delivered a fifth of it, and the rest was a business that exists, has customers, has distribution and has momentum.
For finance, 19% is far larger than the assumption that gets made when a budget is cut. €22.33M is not a rounding error, and removing the plan does not remove a cost, it removes a band from the top of the chart.
Both sides usually argue from their own version of this picture without ever drawing it. Once it is drawn, the argument becomes narrower and much more productive: not whether marketing works, but which weeks that upper band is thickest, what was running then, and what it would take to repeat it.
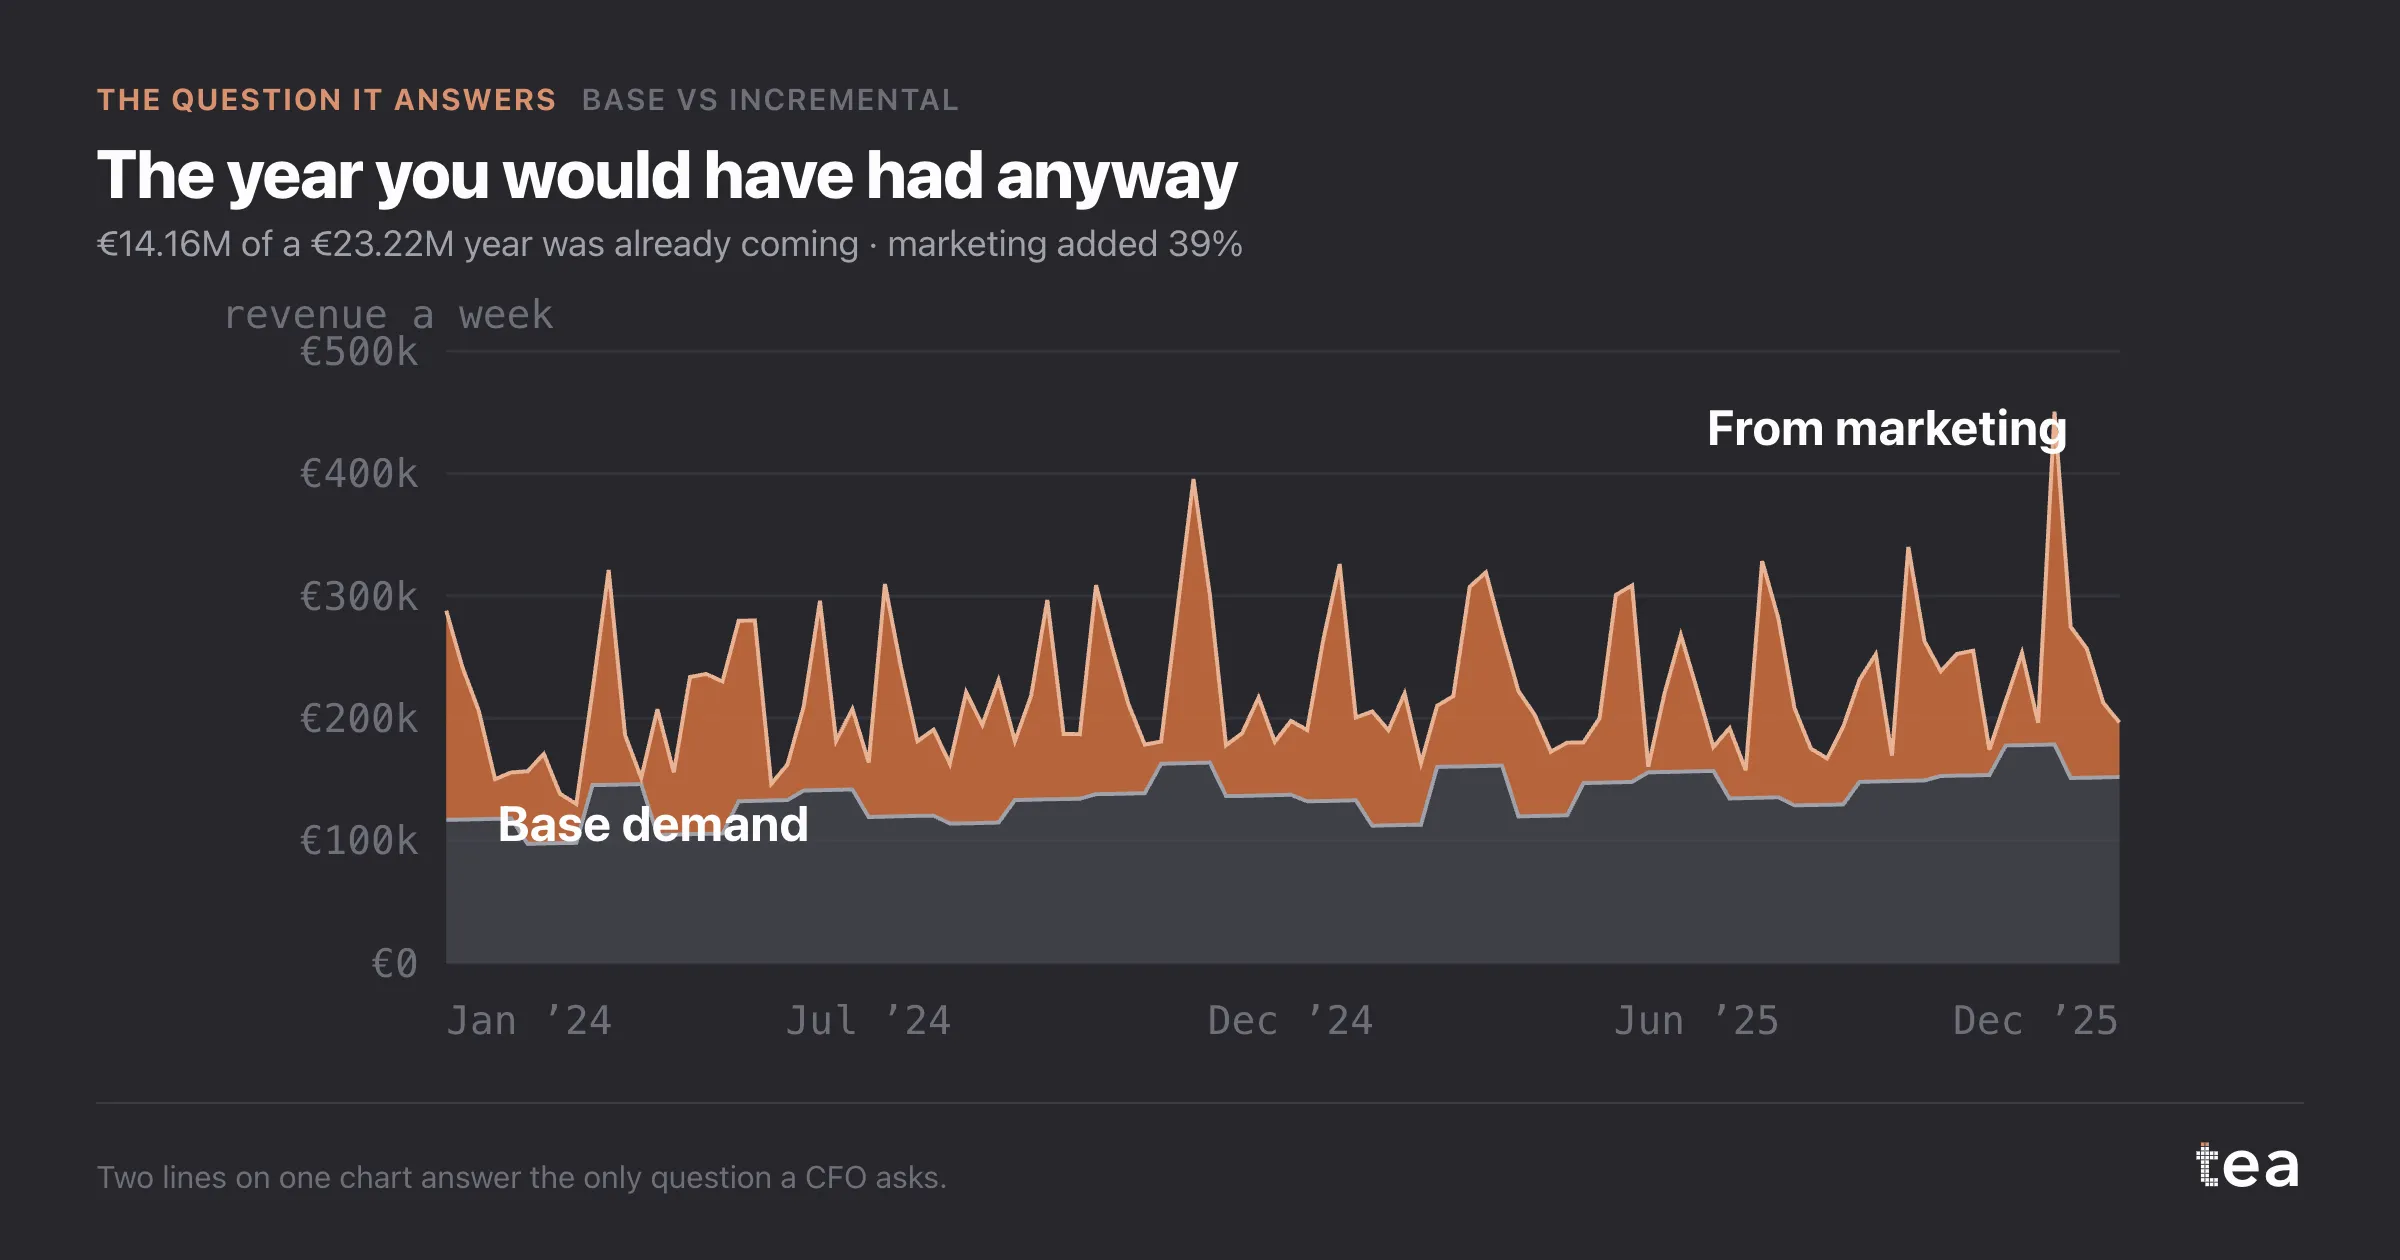
Two honest limits, because a two-band chart invites more certainty than it deserves.
The lower band is a counterfactual, not an observation. Nobody switched the budget off for a year, so it is an estimate from a fitted model, and it carries that model's assumptions.
And the split is only as good as what is in the model. Drivers left out do not disappear, they get absorbed, almost always into the base.
Which is why the interesting question is never the headline percentage. It is which weeks, which drivers, and how sure.
The version of this chart that changes behaviour is the weekly one, not the annual total. The upper band is not a constant fraction: some weeks it is most of the business and some weeks it is almost nothing, and the difference between those weeks is where the plan is actually made.
A year described as "19% incremental" is a fact for the board. The same year described week by week is an instruction for the media team, and they are the same analysis read at two different resolutions.
The answer is in your own file, and so is the disappointment and the reassurance. Most businesses find both in the same chart.
tea, the product
Your file, this question
Fifteen analyses on a CSV of weekly data, with the intervals and the diagnostics shown, and a plain sentence when the data cannot answer. Free while in beta, by invitation.
Request a place in the beta→tea, the product
Fifteen econometric analyses on your own CSV: Base vs Incremental, saturation curves, elasticities, budget allocation. Intervals and diagnostics shown, and a plain sentence when the file cannot answer.
Free while in beta, by invitation.
Request a place in the beta →Liked this? Run it on your own data.
tea runs Base vs Incremental and fourteen other analyses on any weekly CSV, in minutes. Free while in beta, by invitation.