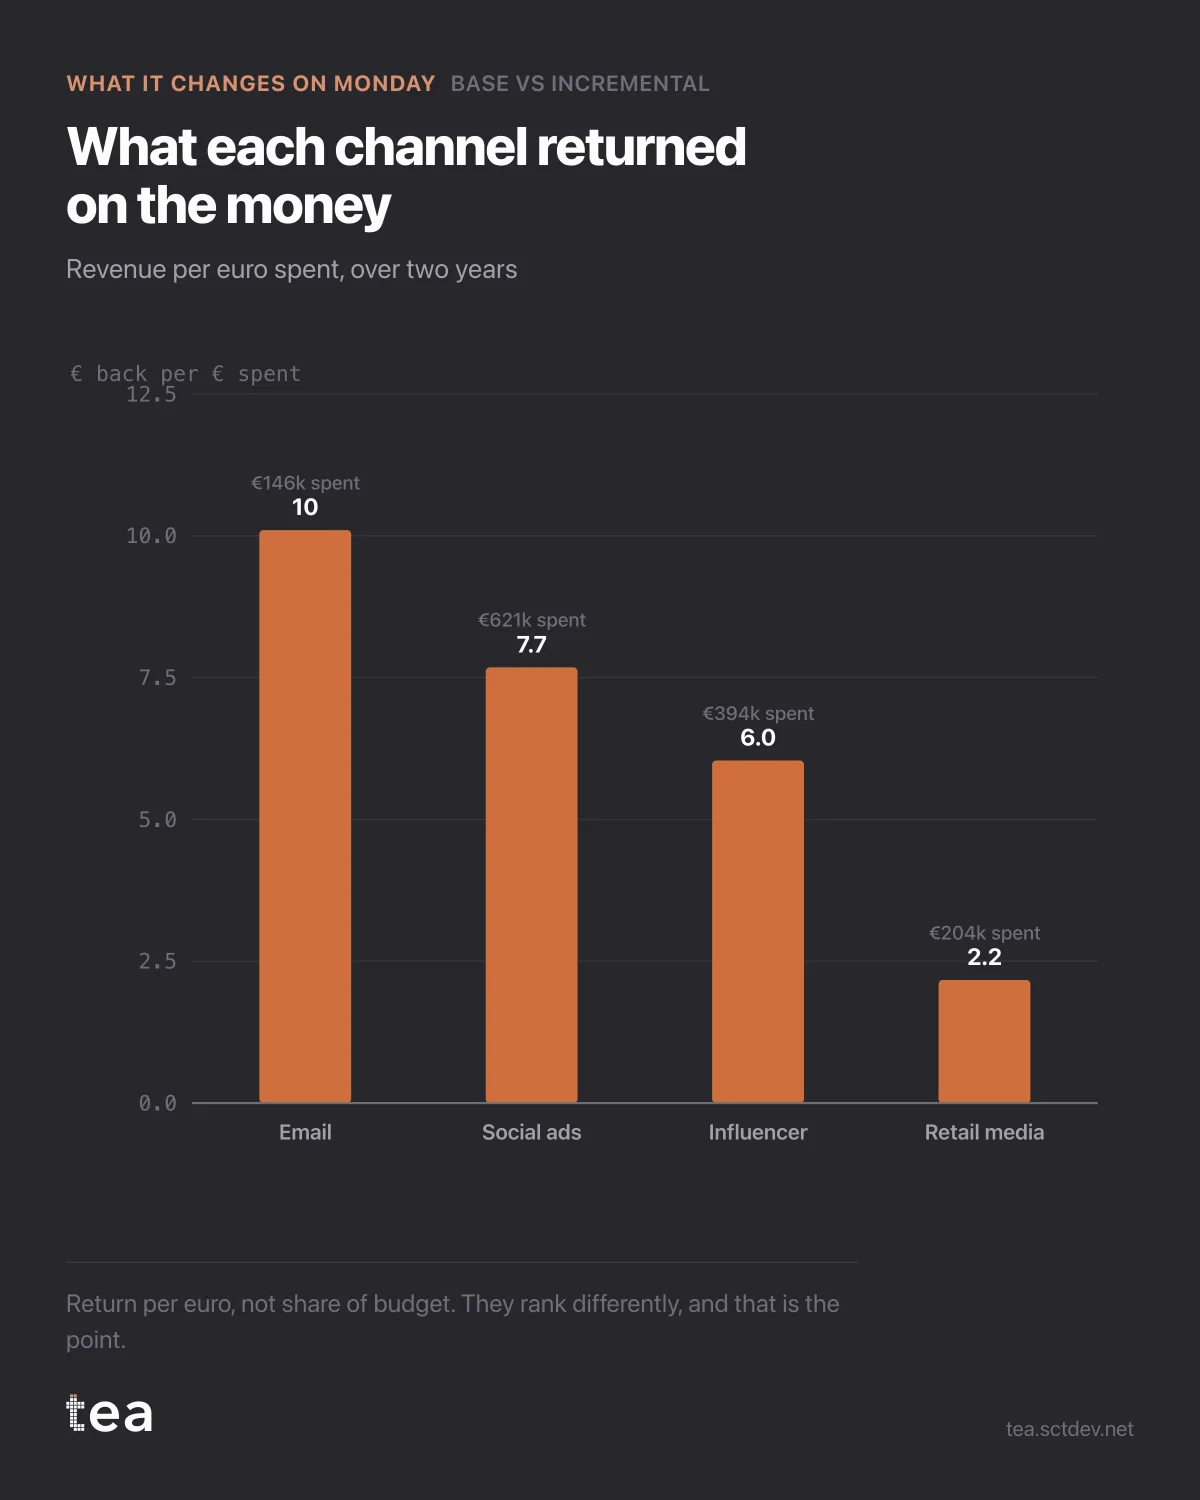
Four channels, ranked by what each euro brought back. Not by spend, not by share of budget, and the ranking is not the one the budget is in.
Email returns €10.10 per euro on €146k of spend. Social ads return €7.68 on €621k. Influencer €6.04 on €394k. Retail media €2.17 on €204k.
The largest budget line is the second most efficient. The most efficient one has the smallest budget in the plan.
Before anyone moves money, three things have to be said about this chart, because it is the one that gets misused most.
Return per euro is an average, not a margin. Email at 10.1 does not mean the next €100k into email returns €1.01M. It means the €146k already spent returned €1.47M, at the level it was spent. The channel might saturate immediately after. The saturation curve answers that, and this chart does not.
Small budgets flatter ratios. A channel spending €146k against a €23M business is operating in the steep part of almost any curve, and it is competing for a very targeted audience that would partly have converted anyway. Scaling it ten times will not preserve the ratio.
And retail media at 2.17 is not necessarily a failure. It is the cheapest number to misread on the page, because a channel that is genuinely incremental at a low multiple can still be the right place for volume when the efficient channels are tapped out.
So the decision this chart supports is narrow and real: it tells you where to test next, in what order, and it tells you which budget line needs an explanation rather than a renewal.
The question to bring to the next planning meeting is not which channel wins. It is why the most efficient line in the plan has the smallest budget, and what would happen if that changed by a third.
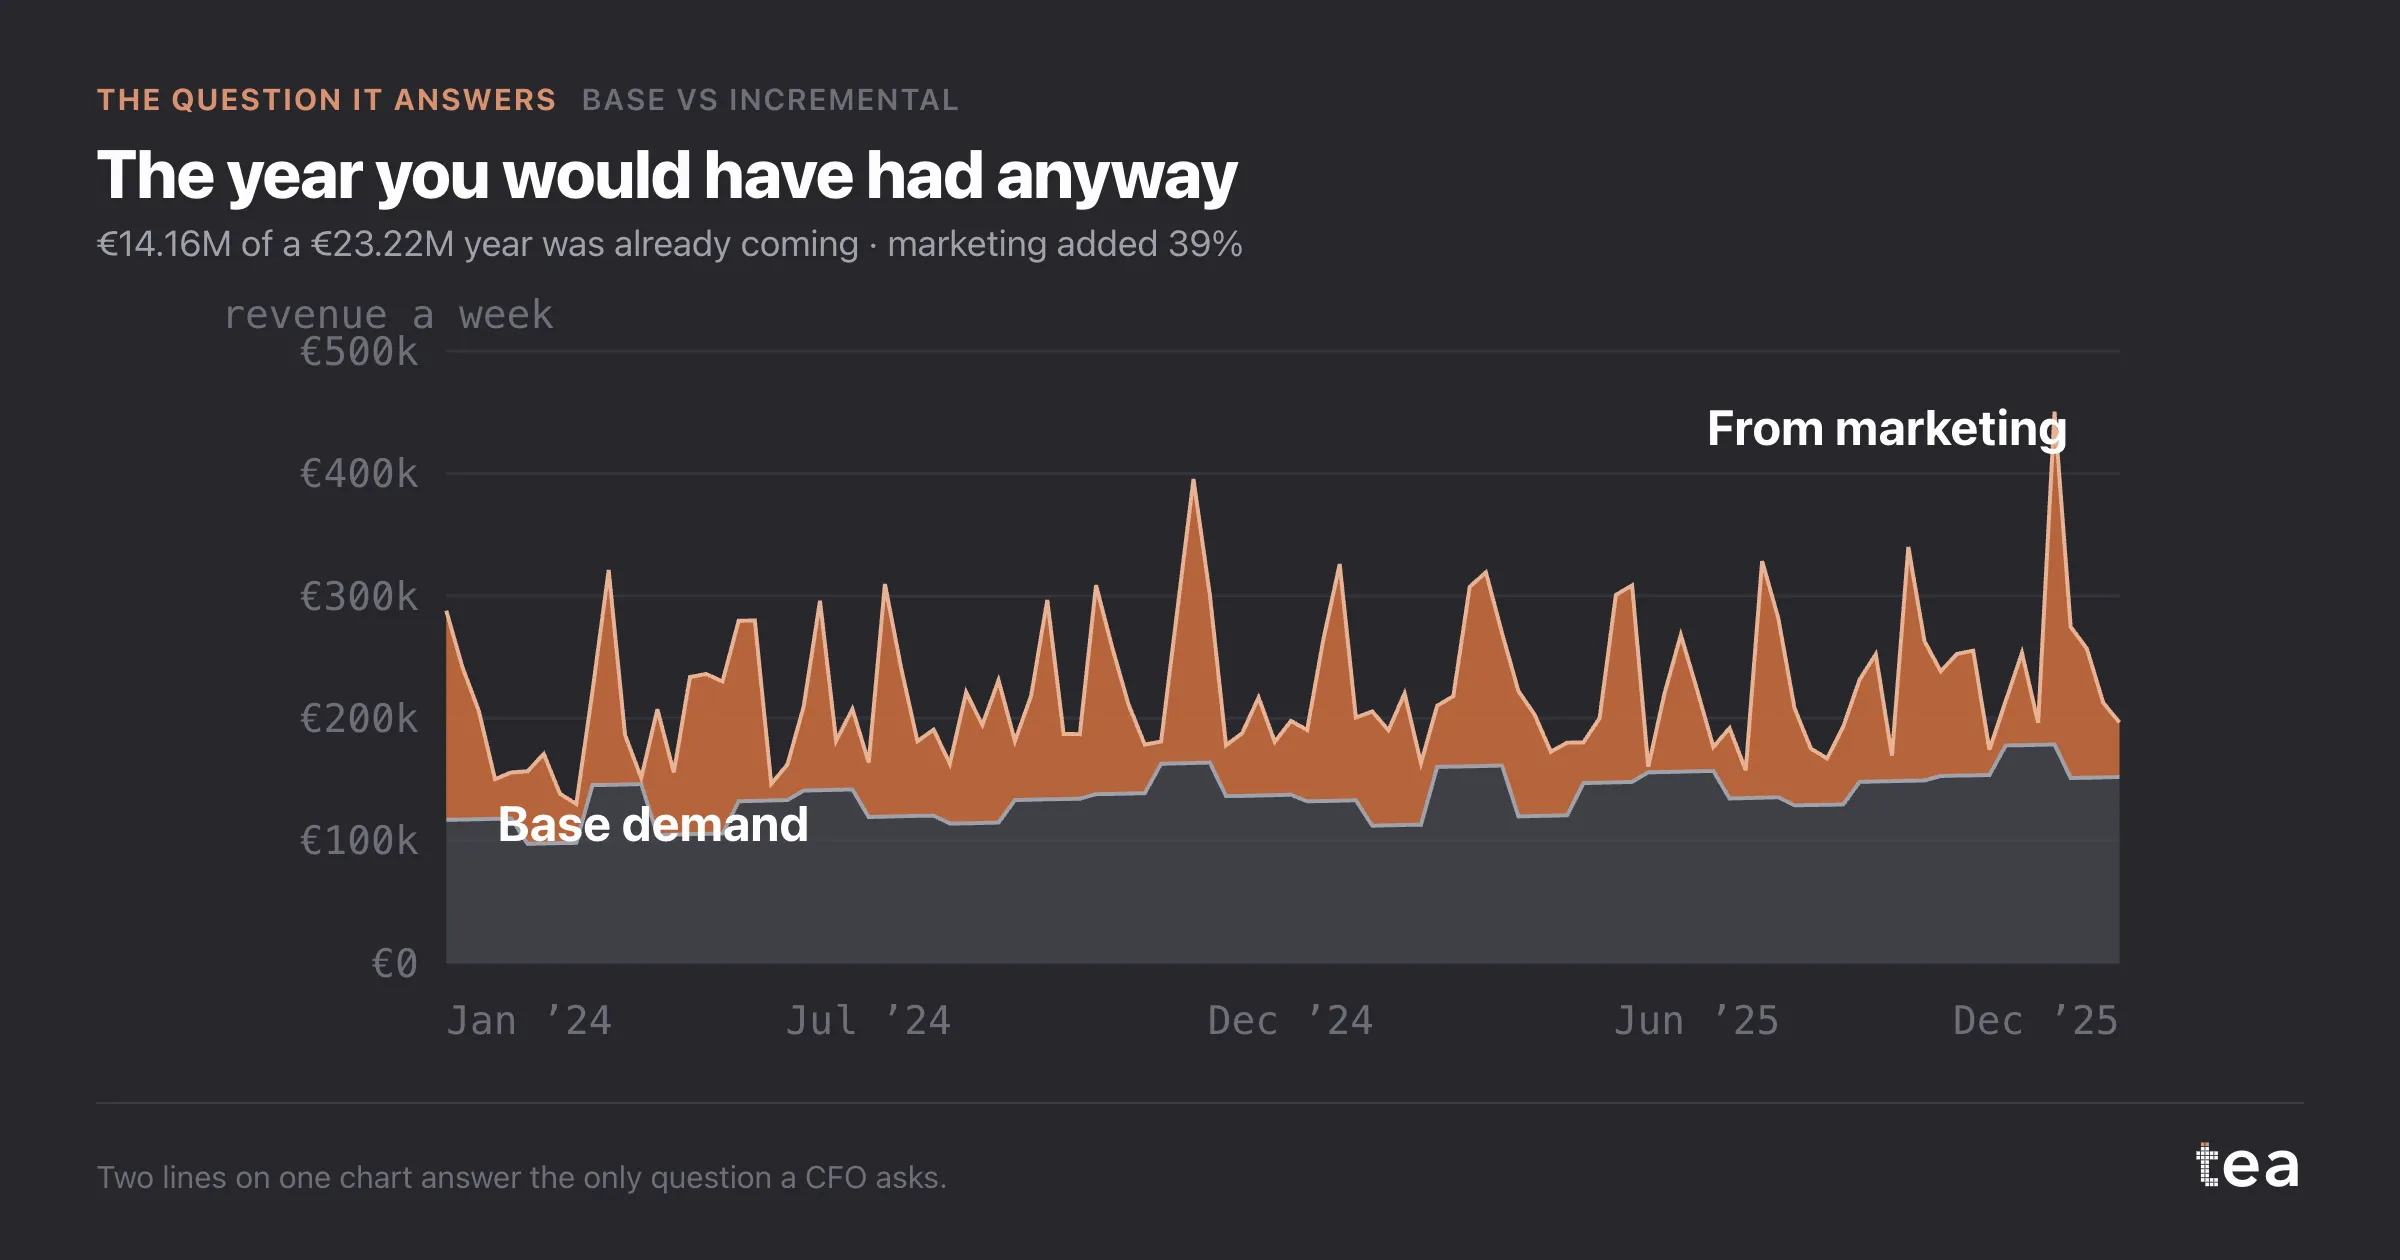
Keep the whole picture in view while you answer it. These four channels produced €9.06M of the year on €1.37M of spend. The other €14.16M was always coming, and no reallocation between these four will change that band.
A last note on how to present this. Put the spend next to the ratio, always. A bar chart of returns without the money behind each bar invites the obvious mistake, which is to move budget toward the tallest bar until the ratio collapses.
The combination that actually works is this chart for the ranking, the saturation curve for the shape, and the budget optimiser for the arithmetic. Any one of them on its own will produce a confident plan, and two of the three ways to be confident here are wrong.
The chart is the actual output of Base vs Incremental in TEA, run on a sample file anyone can download.
tea, the product
Your file, this question
Fifteen analyses on a CSV of weekly data, with the intervals and the diagnostics shown, and a plain sentence when the data cannot answer. Free while in beta, by invitation.
Request a place in the beta→tea, the product
Fifteen econometric analyses on your own CSV: Base vs Incremental, saturation curves, elasticities, budget allocation. Intervals and diagnostics shown, and a plain sentence when the file cannot answer.
Free while in beta, by invitation.
Request a place in the beta →Liked this? Run it on your own data.
tea runs Base vs Incremental and fourteen other analyses on any weekly CSV, in minutes. Free while in beta, by invitation.