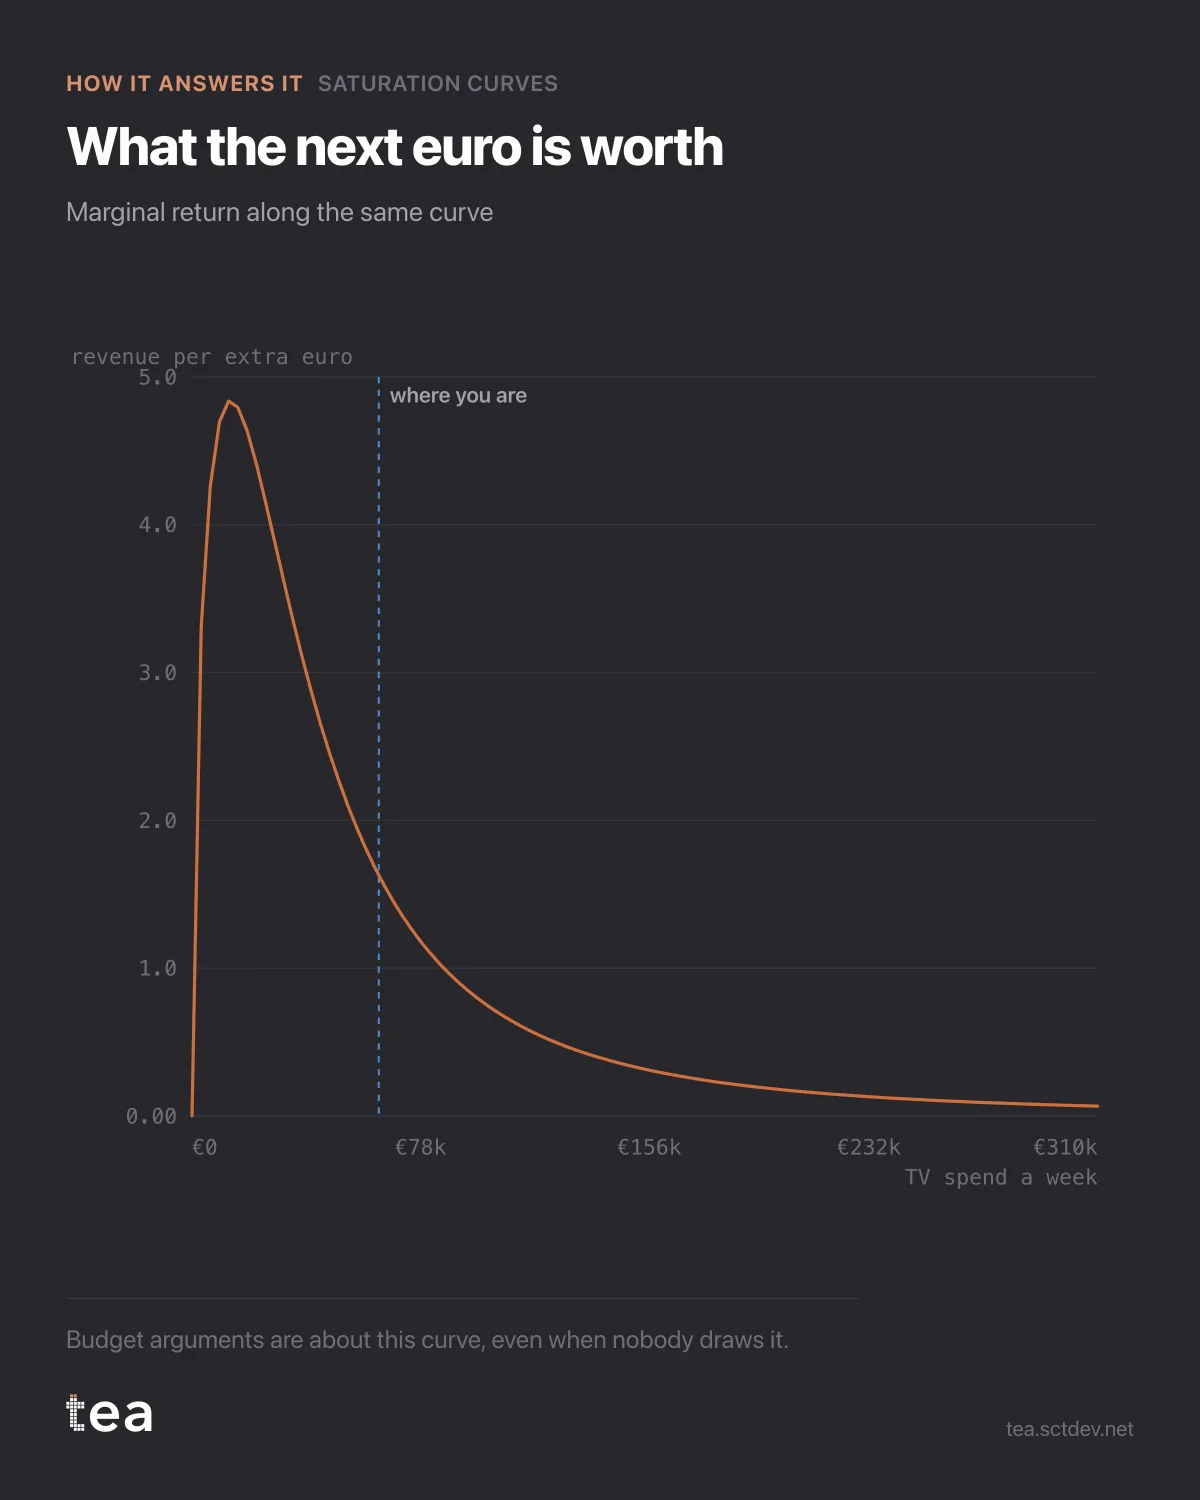
This is the curve that actually decides budgets, and it is not the one people look at.
It is the marginal return: what the next euro buys at each level of spend, which is the slope of the response curve rather than the curve itself.
Average return and marginal return are different numbers, they point in different directions, and almost every budget conversation confuses them.
A channel with a strong average return can have a flat marginal curve, because the average is carrying all the cheap volume it bought at low spend. Moving more money into it buys the flat part. Meanwhile a channel with a mediocre average can be steep exactly where you are, and the next euro there is worth several times more.
Ranking channels by ROI and funding the top of the list is therefore a reliable way to overfund the saturated ones. The list is built on averages. The decision is about margins.
How to read this chart in practice:
Find where you are on the x axis, not where the curve peaks. The question is never "what is the best spend in theory", it is "what does the next unit of money do from here".
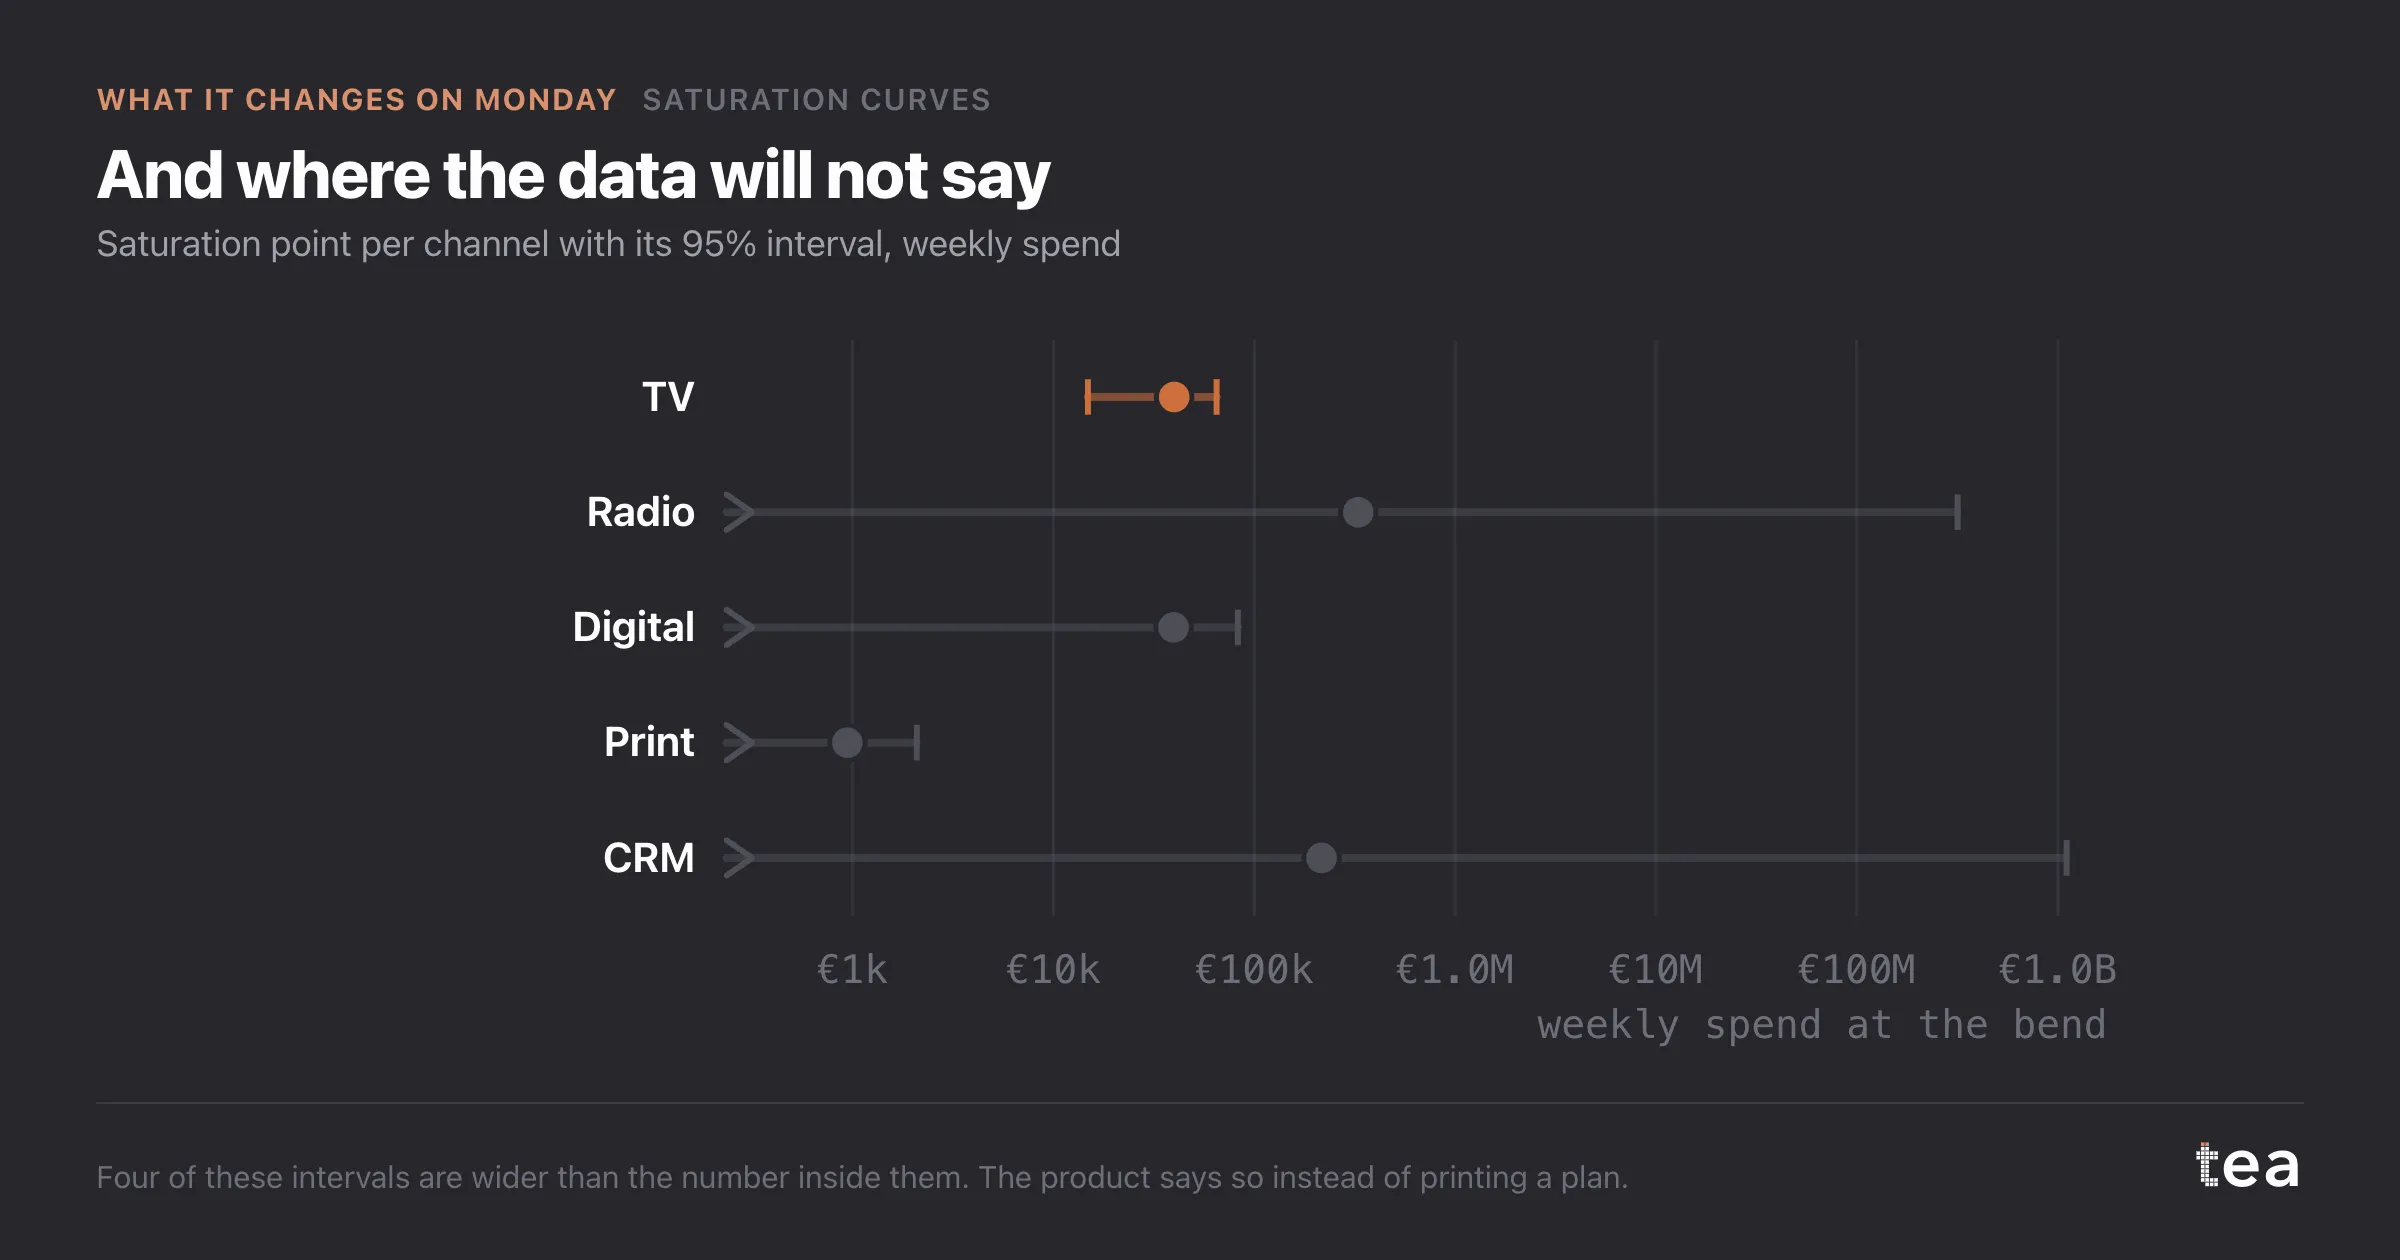
Compare slopes across channels at your actual spend levels. The channel with the steepest slope at its current position is where the next euro goes, and that is the entire logic behind budget optimisation.
And watch the shape near zero. A curve that rises almost vertically at low spend is telling you the first euros are dramatically productive, which usually means the channel is underfunded rather than brilliant, and that the estimate there rests on very few observations.
The honest caveat on this particular fit: R² is 0.50 on the hero channel, and the other four in the file sit between 0.05 and 0.10. One channel out of five is identified well enough to plan against. The rest are not cases of no effect, they are cases of a single channel model being asked a question that needs all the drivers in at once.
That is the boundary of this analysis, and the reason the next one exists.
One sentence to carry into the next budget meeting: the question is not which channel performs best, it is which channel is steepest where we are standing. Those two questions have different answers often enough that the distinction is worth the argument it will start.
And if a channel has no curve at all, say so out loud rather than assigning it an average. A flat line drawn through a channel nobody can measure will be treated as a fact by the third meeting, and it will keep its budget for years on the strength of it.
The chart is the actual output of Saturation Curves in TEA.
tea, the product
Your file, this question
Fifteen analyses on a CSV of weekly data, with the intervals and the diagnostics shown, and a plain sentence when the data cannot answer. Free while in beta, by invitation.
Request a place in the beta→tea, the product
Fifteen econometric analyses on your own CSV: Saturation Curves, saturation curves, elasticities, budget allocation. Intervals and diagnostics shown, and a plain sentence when the file cannot answer.
Free while in beta, by invitation.
Request a place in the beta →Liked this? Run it on your own data.
tea runs Saturation Curves and fourteen other analyses on any weekly CSV, in minutes. Free while in beta, by invitation.