A trend line will fit anything. That is the problem with trend lines.
Draw one through a random walk and you get a slope, an R², and a story. The slope is real in the sense that the arithmetic is correct. It is not real in the sense that next year will follow it.
So before the slope goes into a plan, ask the series one question: is what the line missed just noise, or is it the actual shape of the data?
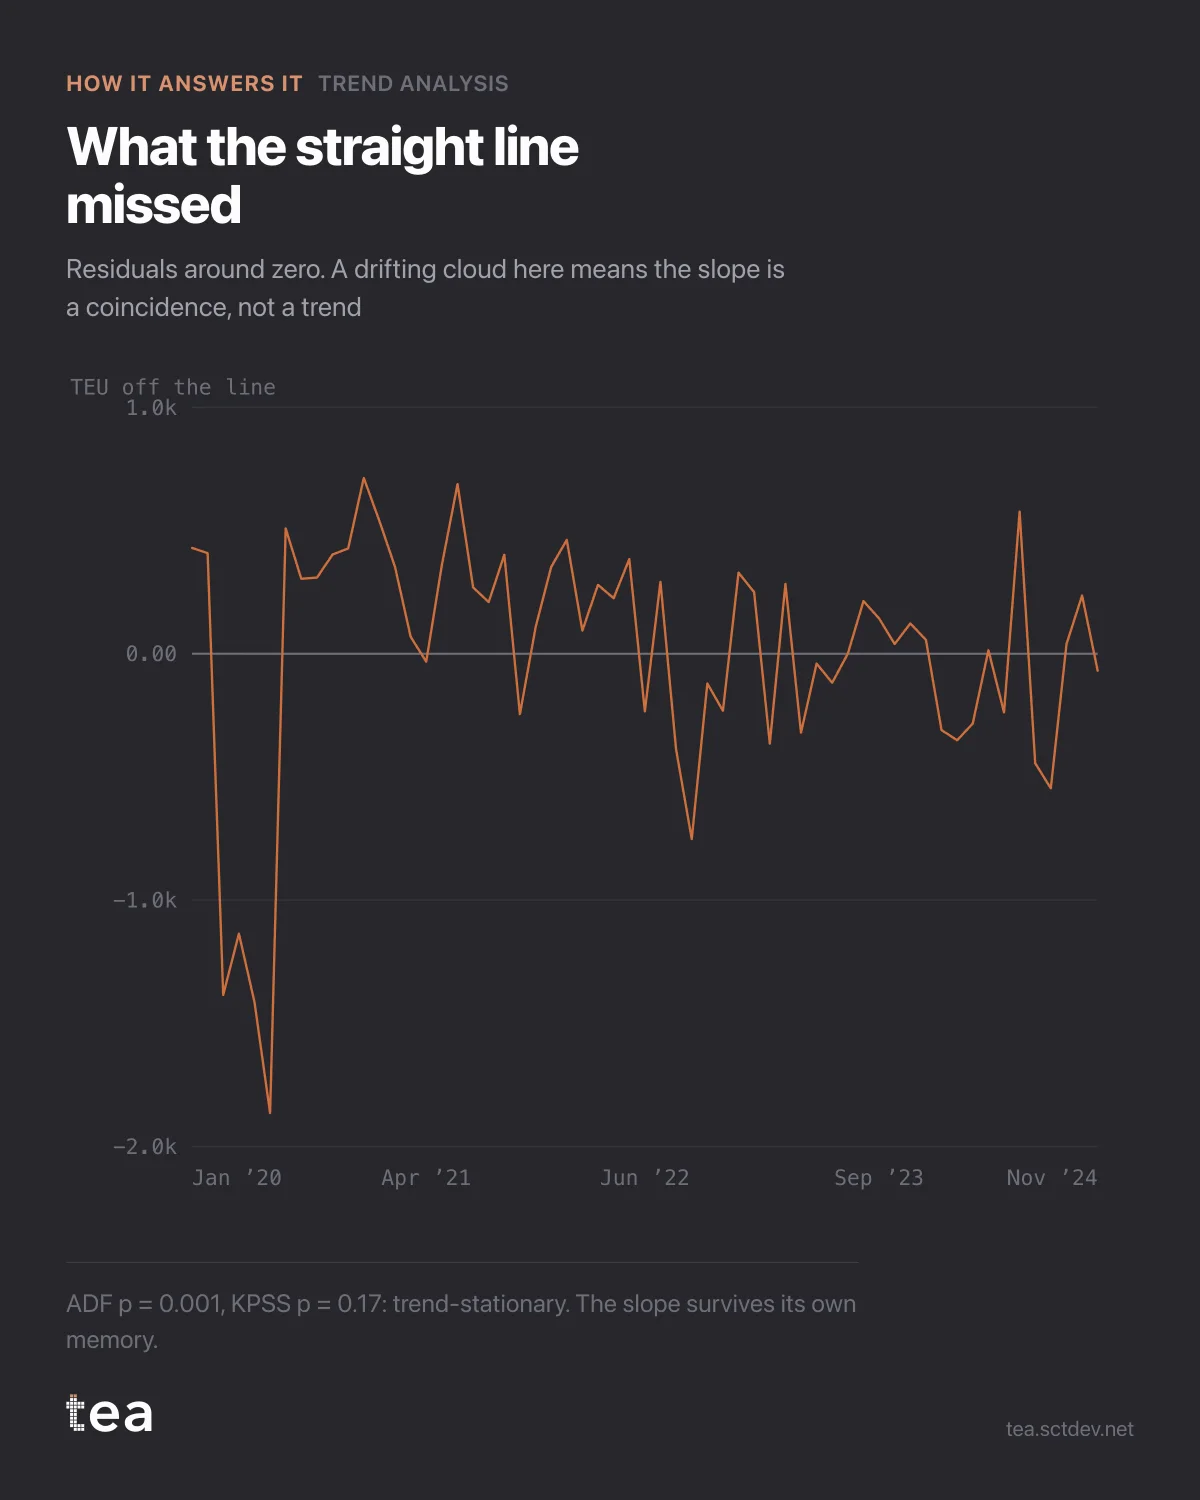
The chart is the residuals. Same fit as three weeks ago, with the line subtracted. What you want to see is a cloud around zero with no memory of itself. What you do not want is a slow wave, where a month above the line is followed by three more above the line, because that is a series carrying its own momentum and a straight line is the wrong instrument for it.
Two tests decide it, and they disagree by design.
ADF p = 0.001. The null is a unit root, a series with no fixed level that wanders wherever the last shock left it. At 0.001 that null is rejected.
KPSS p = 0.17. The null is the opposite: the series is stationary around its trend. At 0.17 that null survives.
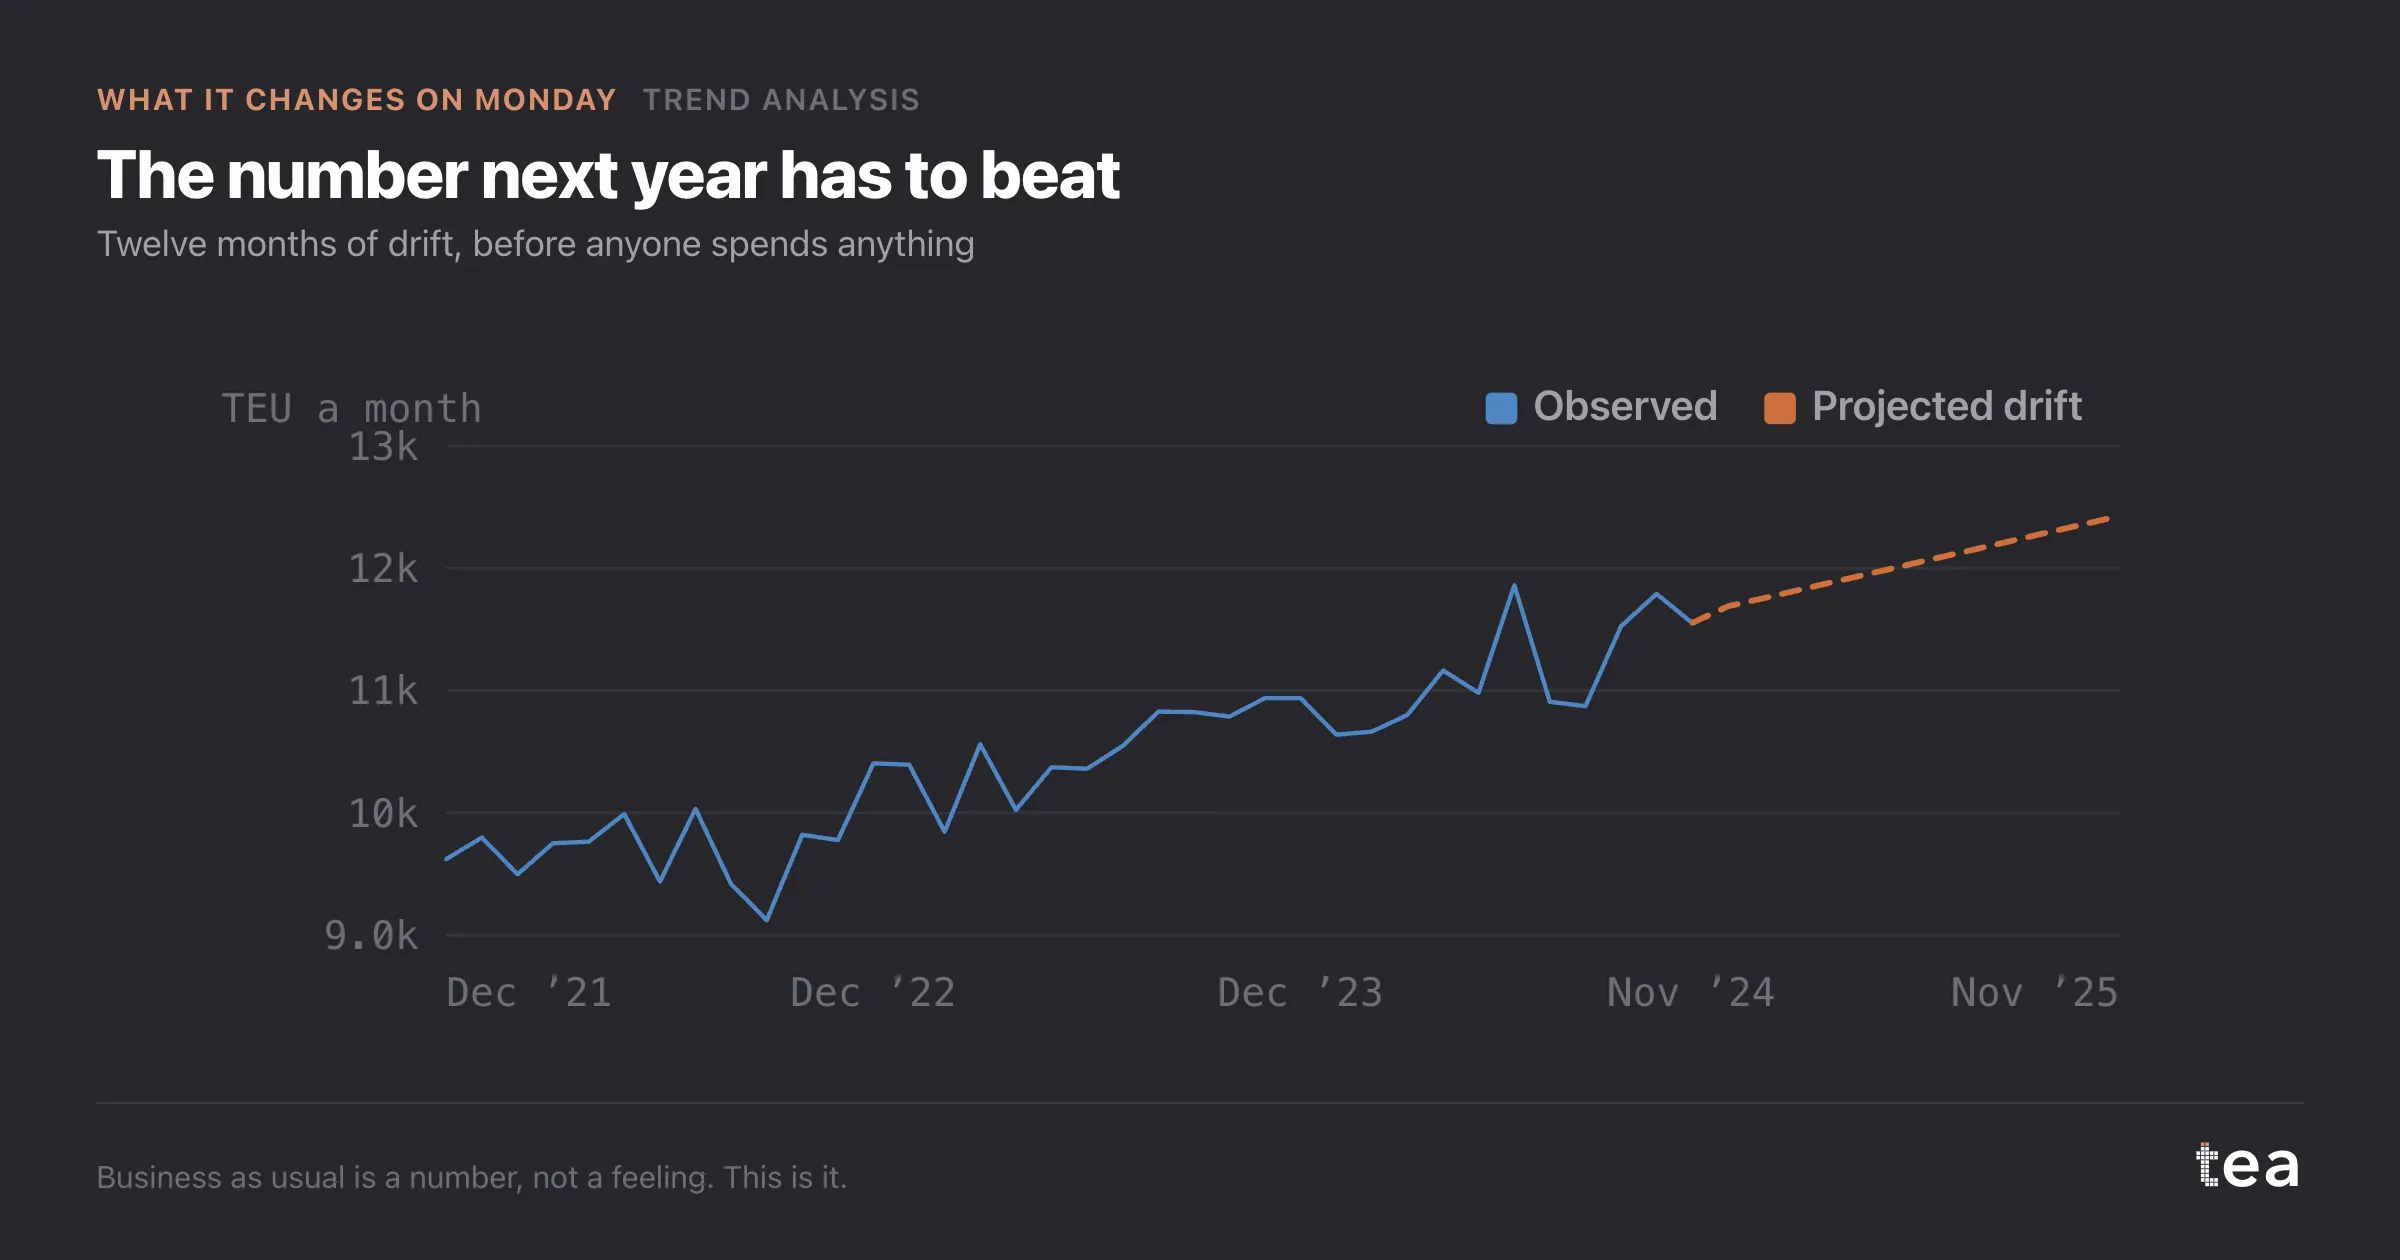
Both point the same way, which is the only configuration worth acting on. The verdict is trend-stationary: this series has a level it returns to, and the level moves in a straight line. The slope survives its own memory.
Run the two tests against a random walk and you get the opposite pair, and a slope you should never have quoted. This is the difference between a trend and a coincidence that lasted five years.
One more line worth reading twice: the standard error here is HAC, Bartlett at bandwidth n/2, with fixed-b critical values. In plain terms, the error bar is widened to account for the residuals being correlated, because assuming independence on a monthly series is how a p-value becomes theatre.
A trend is not a line you draw. It is a claim you test, and the test can say no.
There is a practical reason this matters in marketing specifically. Incrementality, media mix, attribution: all of them measure a campaign against a counterfactual, and the counterfactual is almost always some version of this line. If the line is fitted to a series that wanders, every euro of measured contribution downstream inherits that mistake, and it inherits it silently.
Two tests and a widened standard error take a few seconds. Finding out eighteen months later that the baseline was a random walk takes a budget cycle.
The chart is the actual output of Trend Analysis in TEA. The diagnostics come with the slope, not on request.
tea, the product
Your file, this question
Fifteen analyses on a CSV of weekly data, with the intervals and the diagnostics shown, and a plain sentence when the data cannot answer. Free while in beta, by invitation.
Request a place in the beta→tea, the product
Fifteen econometric analyses on your own CSV: Trend Analysis, saturation curves, elasticities, budget allocation. Intervals and diagnostics shown, and a plain sentence when the file cannot answer.
Free while in beta, by invitation.
Request a place in the beta →Liked this? Run it on your own data.
tea runs Trend Analysis and fourteen other analyses on any weekly CSV, in minutes. Free while in beta, by invitation.