Next year's target is being set somewhere right now, and in most rooms it is being set by adding a percentage to this year.
Here is the alternative, and it takes about a minute.
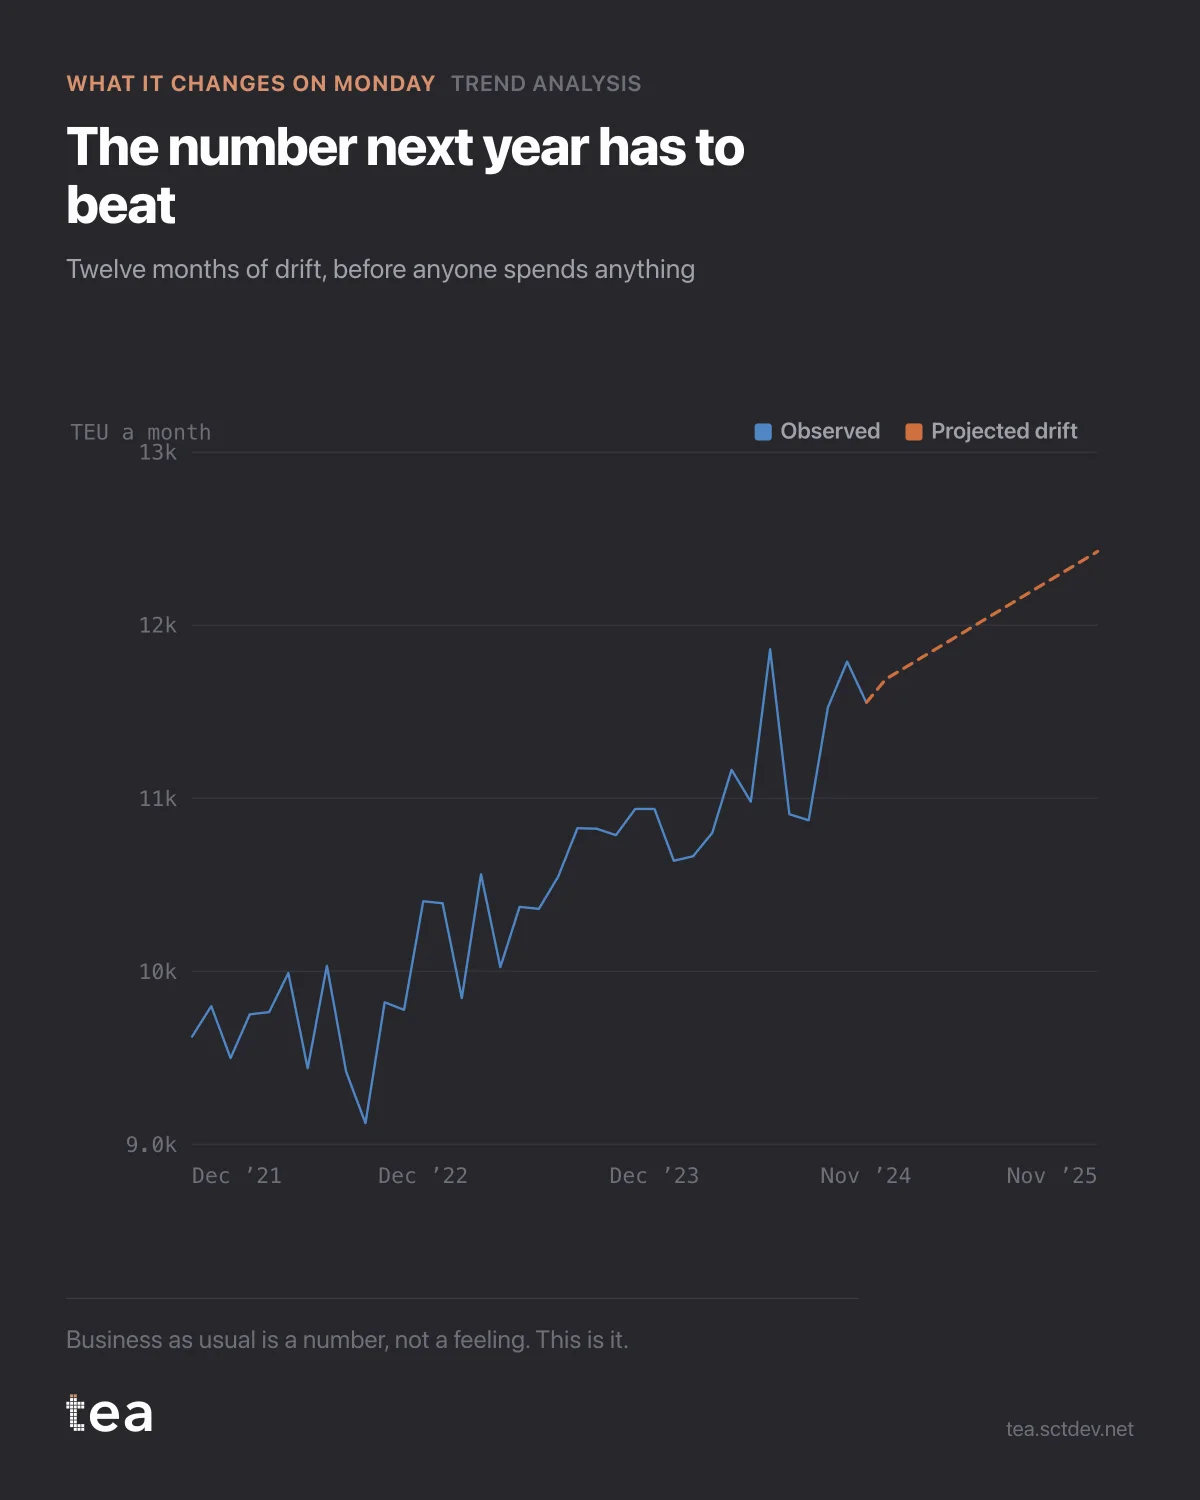
The dashed line is the structural drift of the business projected twelve months forward. No campaign in it, no pricing move, no new customer. Just the slope the last five years have been running at, carried on.
It lands at 12,427 TEU a month. That is the number the year has to beat before anyone gets to claim anything.
Three things change once that line exists.
The target stops being a negotiation. "Plus 8%" is a position in a meeting. "Plus 8% against a baseline that is already climbing 67 units a month" is a statement about the world, and the two are very different conversations to be in.
The campaign gets a fair test. If the business grows and the plan delivered nothing, the trend line shows it. If the business shrinks and the plan held the fall, the trend line shows that too, and that second case is the one that gets people fired for no reason.
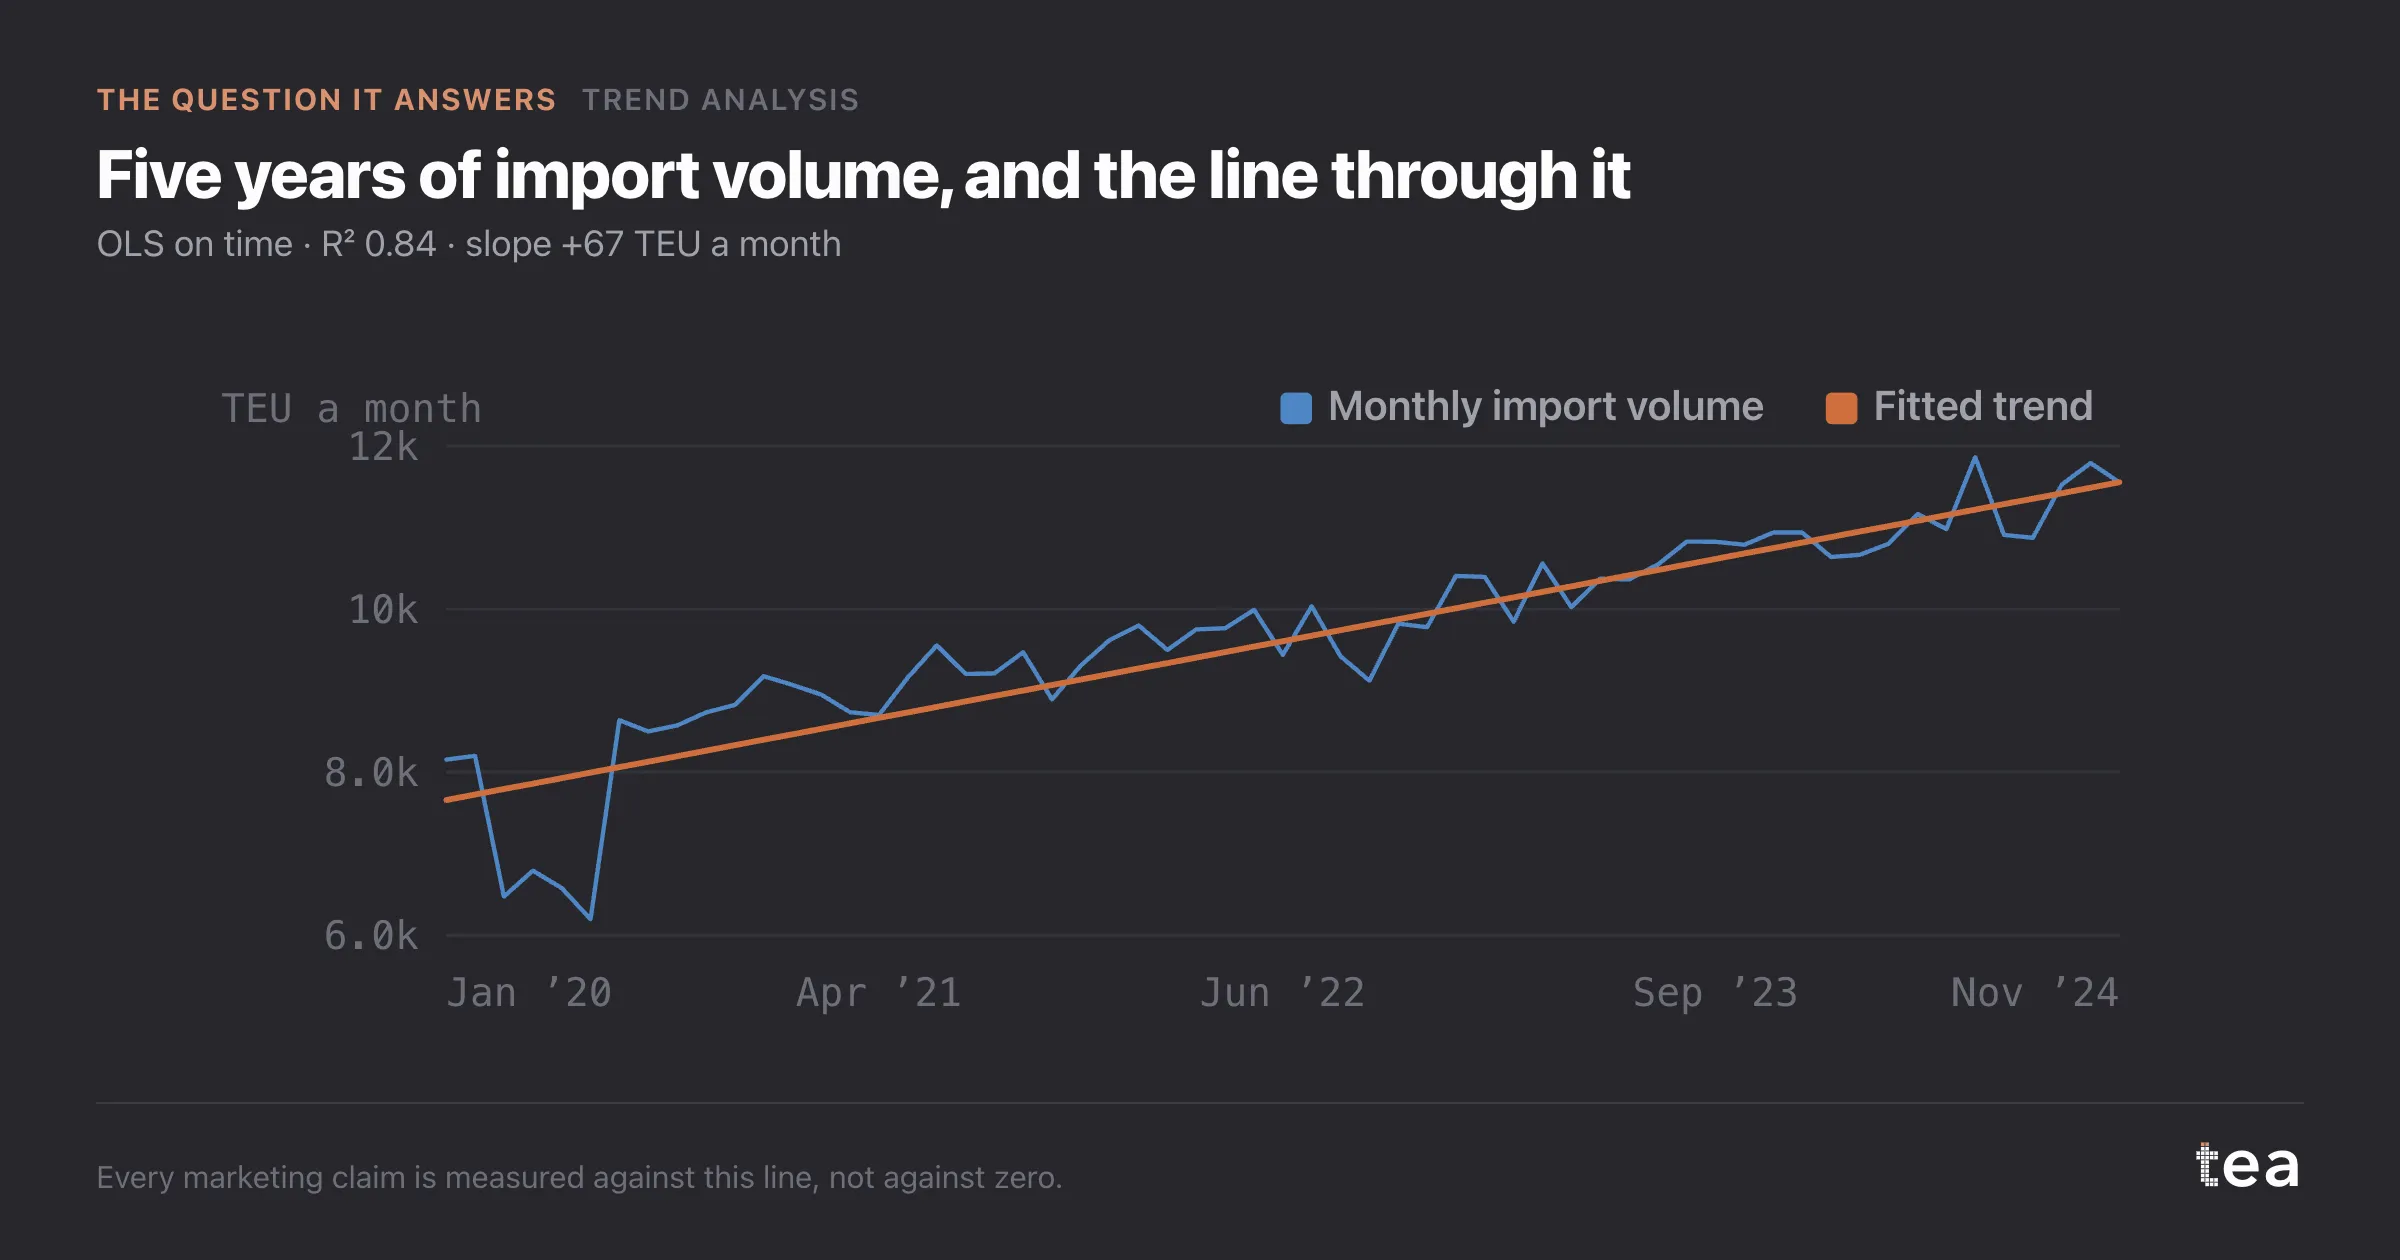
And the forecast gets an expiry date. This projection is a straight line, not a model of the future: it assumes the conditions that produced the slope keep holding. Twelve months is already generous on 59 observations. Anyone extending it to five years is drawing, not forecasting.
That is the whole discipline. Not a better number, a number you can defend when someone asks where it came from.
The most expensive sentence in marketing is "revenue is up". The second most expensive is "compared to last year". Both cost the same thing: you never find out what you actually did.
A practical note on how to use it. Take the projection as the floor of the plan, not as the plan. It answers one question, which is where the business goes untouched. Then the next analyses answer the others: what the calendar will do to those months, what the campaigns added last time, and which of them is still climbing. Each one sits on top of this line rather than replacing it.
That is also why it is the first thing to run and the cheapest. One column of history, twelve months of horizon, and the argument about the target becomes an argument about evidence.
The chart is the actual output of Trend Analysis in TEA, and the projection comes from the same fit as the slope, not from a second guess.
tea, the product
Your file, this question
Fifteen analyses on a CSV of weekly data, with the intervals and the diagnostics shown, and a plain sentence when the data cannot answer. Free while in beta, by invitation.
Request a place in the beta→tea, the product
Fifteen econometric analyses on your own CSV: Trend Analysis, saturation curves, elasticities, budget allocation. Intervals and diagnostics shown, and a plain sentence when the file cannot answer.
Free while in beta, by invitation.
Request a place in the beta →Liked this? Run it on your own data.
tea runs Trend Analysis and fourteen other analyses on any weekly CSV, in minutes. Free while in beta, by invitation.