ea

Analyses/Pricing & Promo Path/Price Elasticity

What a price move does to your volume.

Price Elasticity measures how much your volume answers a one per cent move in your own price, with promotions and competitor prices held apart. It says which side of the line you are on before anyone touches the list price.

Answers What does a 1% price move cost in volume? Needs Weekly volume, and a price that moved Hands back Elasticity, interval, revenue curve, scenarios

Volume against price relative to the shelf

156 weeks, units a week
  • A week
  • Fitted demand, elasticity −1.4
Elasticity−1.495% interval −1.8 to −1.0
A 5% rise, with the shelf−1.8% volumebetween −1.3% and −2.3%
Revenue, same move+3.1%about €236k a year

The one-litre washing-up liquid of a household-goods maker in Italian grocery, from the first example below. A composite case: your file draws its own curve, with its interval.

01

What it is for

Every price is a bet on how shoppers will answer it. An elasticity is that answer measured on the weeks your price actually moved, with the interval that says how far to trust it.

Deciding a list-price round

Beyond −1, a rise loses more in volume than it gains per unit and revenue falls. Inside it, the rise pays. The elasticity says which side you are on, and the scenarios put ±10, 20 and 30% into volume and revenue.

Moving with the shelf, not alone

Shoppers read a price against the one next to it. With a competitor or category price in the file, the same 5% can be a mistake on its own and a sensible move in company, and the model can tell the two apart.

Giving the next steps a base

A discount is partly a price change, and a rival’s cut matters only in proportion to your own price. Promo and cross-elasticity both need this number first, or they credit price to something else.

02

How to read it

The top of every result: a badge, four numbers and two charts, here on tea’s grocery sample file, 312 weekly observations across four regions. Read them in this order.

Elasticity analysis Elastic1
Price Elasticity −1.5172 p-value < 0.0013 R² 90.0%4 Current price €2.145

Price-demand curve

Revenue index vs price

  1. The badge. Elastic, inelastic, unit elastic, perfectly inelastic, or Giffen. Unit elastic is a band within 5% of −1, and Giffen means demand rose with price: the page then asks you to check the data before quoting anything.
  2. The elasticity. The per cent change in volume for a one per cent change in price. −1.517 means a 1% rise costs about 1.5% of volume. The 95% interval sits under it, −1.851 to −1.183 here, and the two are read together.
  3. The p-value. Whether a slope this size could come from no relationship at all. Below 0.05 the page calls it significant. Above it, the elasticity is a direction, and the interval says how wide.
  4. The fit, R². How much of the weekly movement in volume the model explains, with the observations under it. 90% is high because promotion depth and the competitor’s price are in the model too. A high R² does not prove the elasticity right; a low one is a reason to look for what is missing.
  5. The current price. Not today’s shelf price: the mean price over the file. The revenue index and the ±10, 20 and 30% scenarios are anchored to it, so on a file where the price drifted up over the years, “current” sits behind the shelf.

03

Where it sits in the analysis

Price Elasticity opens the Pricing & Promo Path, the path that ends on a number for a pricing meeting. It comes first because every discount and every competitor move is read against how much your own price matters.

What you carry into the next step is one number, the own-price elasticity, with its interval. Promo Elasticity takes your price as a control so the discount is not credited with what the price did, and Cross-Elasticity puts it beside each competitor’s.

When price is one driver among media and promotion, Contribution Decomposition puts the three side by side and says which one moved the KPI.

Pricing & Promo Path

  1. Price Elasticity this page

    How demand answers a price move, with the confidence band and the revenue curve.

    Carries forward: own-price elasticity

  2. Promo Elasticity

    The incremental lift of the promotions, net of the demand that was coming anyway.

  3. Cross-Elasticity

    Whether the competitor move takes your volume or leaves it alone.

  4. Scenario Simulation

    The price and promo calendar you are considering, run against all three elasticities at once.

04

Where it usually misleads

A log-log regression is the easy part. The problems are in the price column and in what moved with it, and most of them produce a number that looks like a finding.

A price that never moved, or barely did

An elasticity is a slope, and a slope needs weeks at a higher price and weeks at a lower one. One price for three years gives no slope at all. A price that moved a tenth of a per cent gives an interval wide enough to hold every answer. Second example below.

When the price column never changes, the run stops and says so instead of printing a number. Scouting the file first measures how far the price moved, and warns when the interval would be too wide to plan on.

Promotion weeks credited to price

A week at 25% off has a lower price and a display at the end of the aisle. Fit volume on price alone and the display is counted as price, so shoppers look far more sensitive than they are.

Add the promotion depth column: it goes into the same regression as a control, and its own coefficient is printed beside the elasticity.

Your price read without the shelf

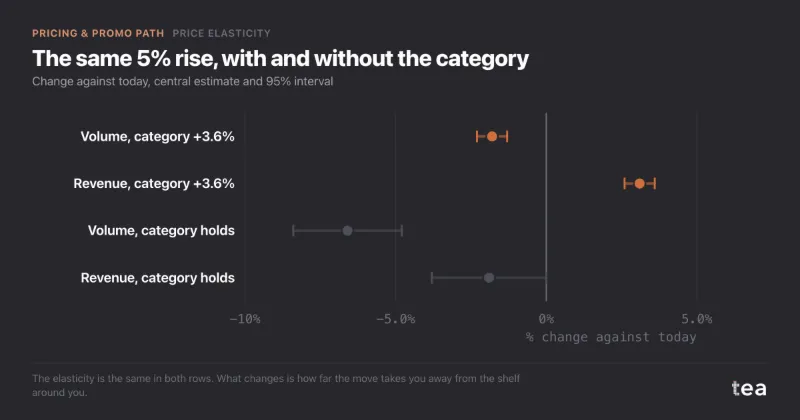
Shoppers read a price against the bottle next to it. The same 5% rise costs 1.8% of volume when the category rises 3.6% around it, and 6.6% when it does not. Without competitor prices in the file, the model cannot tell the two moves apart. First example below.

Add a competitor or category price column: it goes in as a control, and the cross-price elasticity is printed with its p-value.

A correlation read as an experiment

Prices are set by people who watch demand: raised in strong weeks, cut in weak ones. That pulls the measured slope towards zero, and sometimes past it. No number of control columns turns observed prices into a test.

A positive slope is labelled Giffen, and the page says to check the data before quoting it. A negative one deserves the same care: when the decision is large, confirm it with a small price test in a few stores.

One number for three years

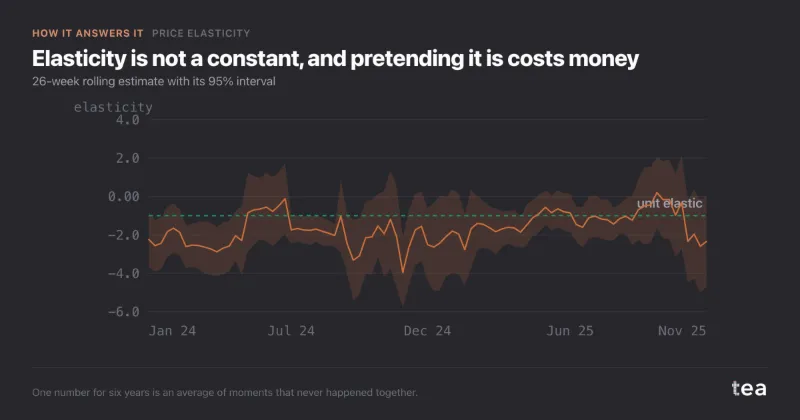
Elasticity is a property of the market, not of the product. It shifts with competitors, with the promotional mix, with inflation. On tea’s grocery sample the pooled −1.52 hides a rolling estimate that runs from −3.95 to +0.20.

Every result carries a rolling elasticity, re-estimated on windows of 26 periods with its 95% band, and a line that says whether it is drifting.

The curve read past the evidence

The revenue curve and the scenarios run to 30 and 40% either side of the mean price, whether or not the file ever went there. At the edges the estimate rests on the fewest weeks, and it is revenue, not margin: the price that maximises one can destroy the other.

The demand chart draws every observed week beside the fitted curve, so the edge of the evidence is visible. Read the scenarios only where the dots reach, and convert revenue to margin before deciding.

05

Two examples

One file where the analysis changed a decision, one where it could not answer. Both are useful results.

Helps

The 5% rise that paid because the shelf moved too

A household-goods maker sold about 42,000 bottles a week of its one-litre washing-up liquid in Italian grocery, at €3.49. Two years earlier a 6% rise taken alone had cost about 8% of volume, and the plan was to hold the price for another year.

Five list-price moves and the competitors’ prices gave the model a real range, 92 to 108 against the shelf. The elasticity came out at −1.4, interval −1.8 to −1.0. With the category rising 3.6% in March, a 5% rise was a relative move of about 1.3%: 1.8% of volume for 3.1% more revenue, about €236k a year. The rise went ahead with the category, and the first eight weeks came in 1.6% down, inside the interval.

Read the full case

The same 5% rise, with and without the shelf

% change against today, with 95% interval

The elasticity is the same in every row. Only the shelf around the move changes.
Does not help

Three years at one price

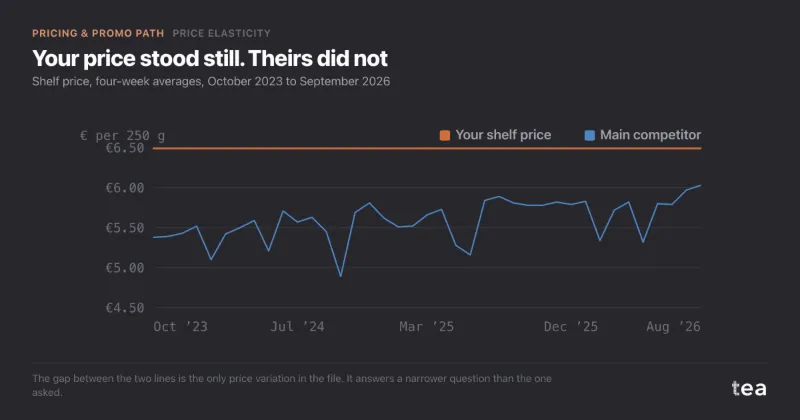
A premium coffee roaster sold about 12,000 bags a week of ground coffee in Italy and Austria, at €6.49, and wanted to know what €6.99 would cost. The file had 156 weeks, with distribution, media and the main competitor’s price. The own price said €6.49 in every row.

With no price variation the slope is not small or uncertain, it is undefined, and tea said so. The gap to the competitor did move, and gave a relative-price estimate of −0.9, interval −1.7 to −0.1: a bound, not the answer. The answer was a design: twelve stores at €6.99 against twelve matched stores at €6.49, for ten weeks.

Read the full case

Your price stood still. Theirs did not

shelf price, four-week averages, € per 250 g
  • Your shelf price
  • Main competitor

The gap between the two lines is the only price variation in the file. It answers a narrower question than the one asked.

06

What the charts add to the numbers

An elasticity is one number, and a pricing meeting needs three answers from it: whether the curve rests on evidence, which way revenue moves, and whether the number still holds.

Price-demand curve

every observed week, and the log-log fit
  • A week
  • Fitted units

Reads as: whether the curve rests on evidence. The slope of the line is the elasticity, the spread of the dots is everything else that moves volume, and where the dots stop, the evidence stops. It is the chart to show before quoting the number.

Revenue index vs price

price × volume along the fitted curve

Reads as: which way to move. The peak of the curve is where revenue is maximised. On an elastic product like this one there is no peak inside the range: the curve falls from left to right, so every cut buys revenue and every rise loses it. It is the chart for a list-price round, and it is revenue, not margin.

Rolling elasticity

windows of 26 periods, with the 95% band
  • Rolling elasticity
  • 95% band

Reads as: whether the number still holds. Where the band is narrow the movement is signal; where it opens, the window had too little price variation to say anything, and the line inside it means little. A drift means a competitor, a relaunch or a different buyer, and a reason to refit before the next price round rather than quote last year’s study.

tea, the product

Measure how your own demand answers price

A CSV with a date, volume and a price. The elasticity, its interval, the revenue curve and the scenarios, in minutes, and a plain sentence when the price never moved. Free while in beta, by invitation.

Request a place in the beta

tea, the product

Fifteen econometric analyses on your own CSV: Price Elasticity, saturation curves, elasticities, budget allocation. The diagnostics shown, and a plain sentence when the file cannot answer.

Free while in beta, by invitation.

Request a place in the beta →

Now run it on your own data.

tea runs Price Elasticity and fourteen other analyses on any weekly CSV, in minutes. Free while in beta, by invitation.

Join the beta