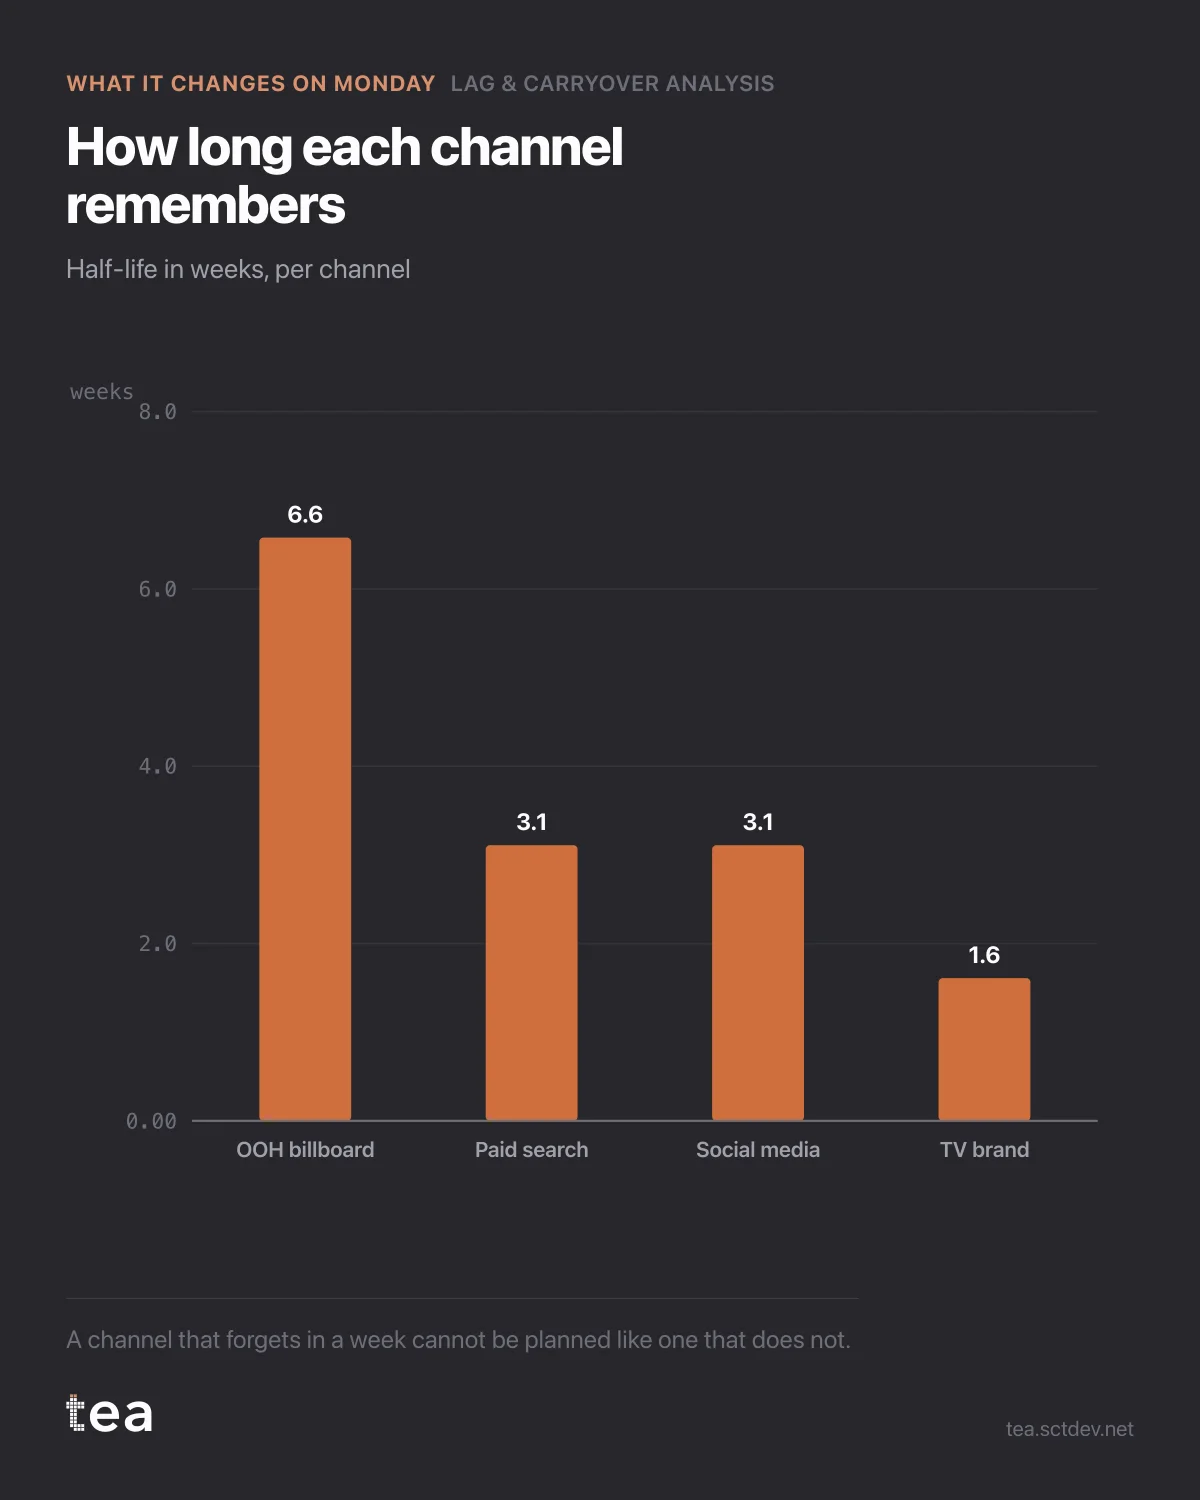
Four channels, four memories. Outdoor 6.6 weeks, social 3.1, paid search 3.1, TV brand 1.6.
One plan, one reporting cycle, one set of rules for all four. That is the mismatch this chart exists to end.
What changes when you know the half-life of each line in the plan:
Flight length follows the decay, not the quarter. A channel with a 6.6 week half-life needs continuity, because every stop throws away a tail you have already paid for. A 1.6 week channel can be bursted hard and moved, because there is very little tail to lose.
The evaluation window follows the decay too. Judging outdoor at four weeks measures roughly two thirds of what it will do. Judging search at four weeks measures nearly all of it. Two channels, same report, two completely different levels of completeness, and the report never mentions it.
The handover between channels gets planned rather than assumed. If the long channel is still delivering for six months and the short one is spent in a fortnight, the sequence matters: the long one leads, the short one converts, and reversing that order pays twice for the same audience.
And budget arguments change shape. "Outdoor did not work" almost always means "outdoor did not work inside our reporting window". Those are different claims, and only one of them is about the channel.
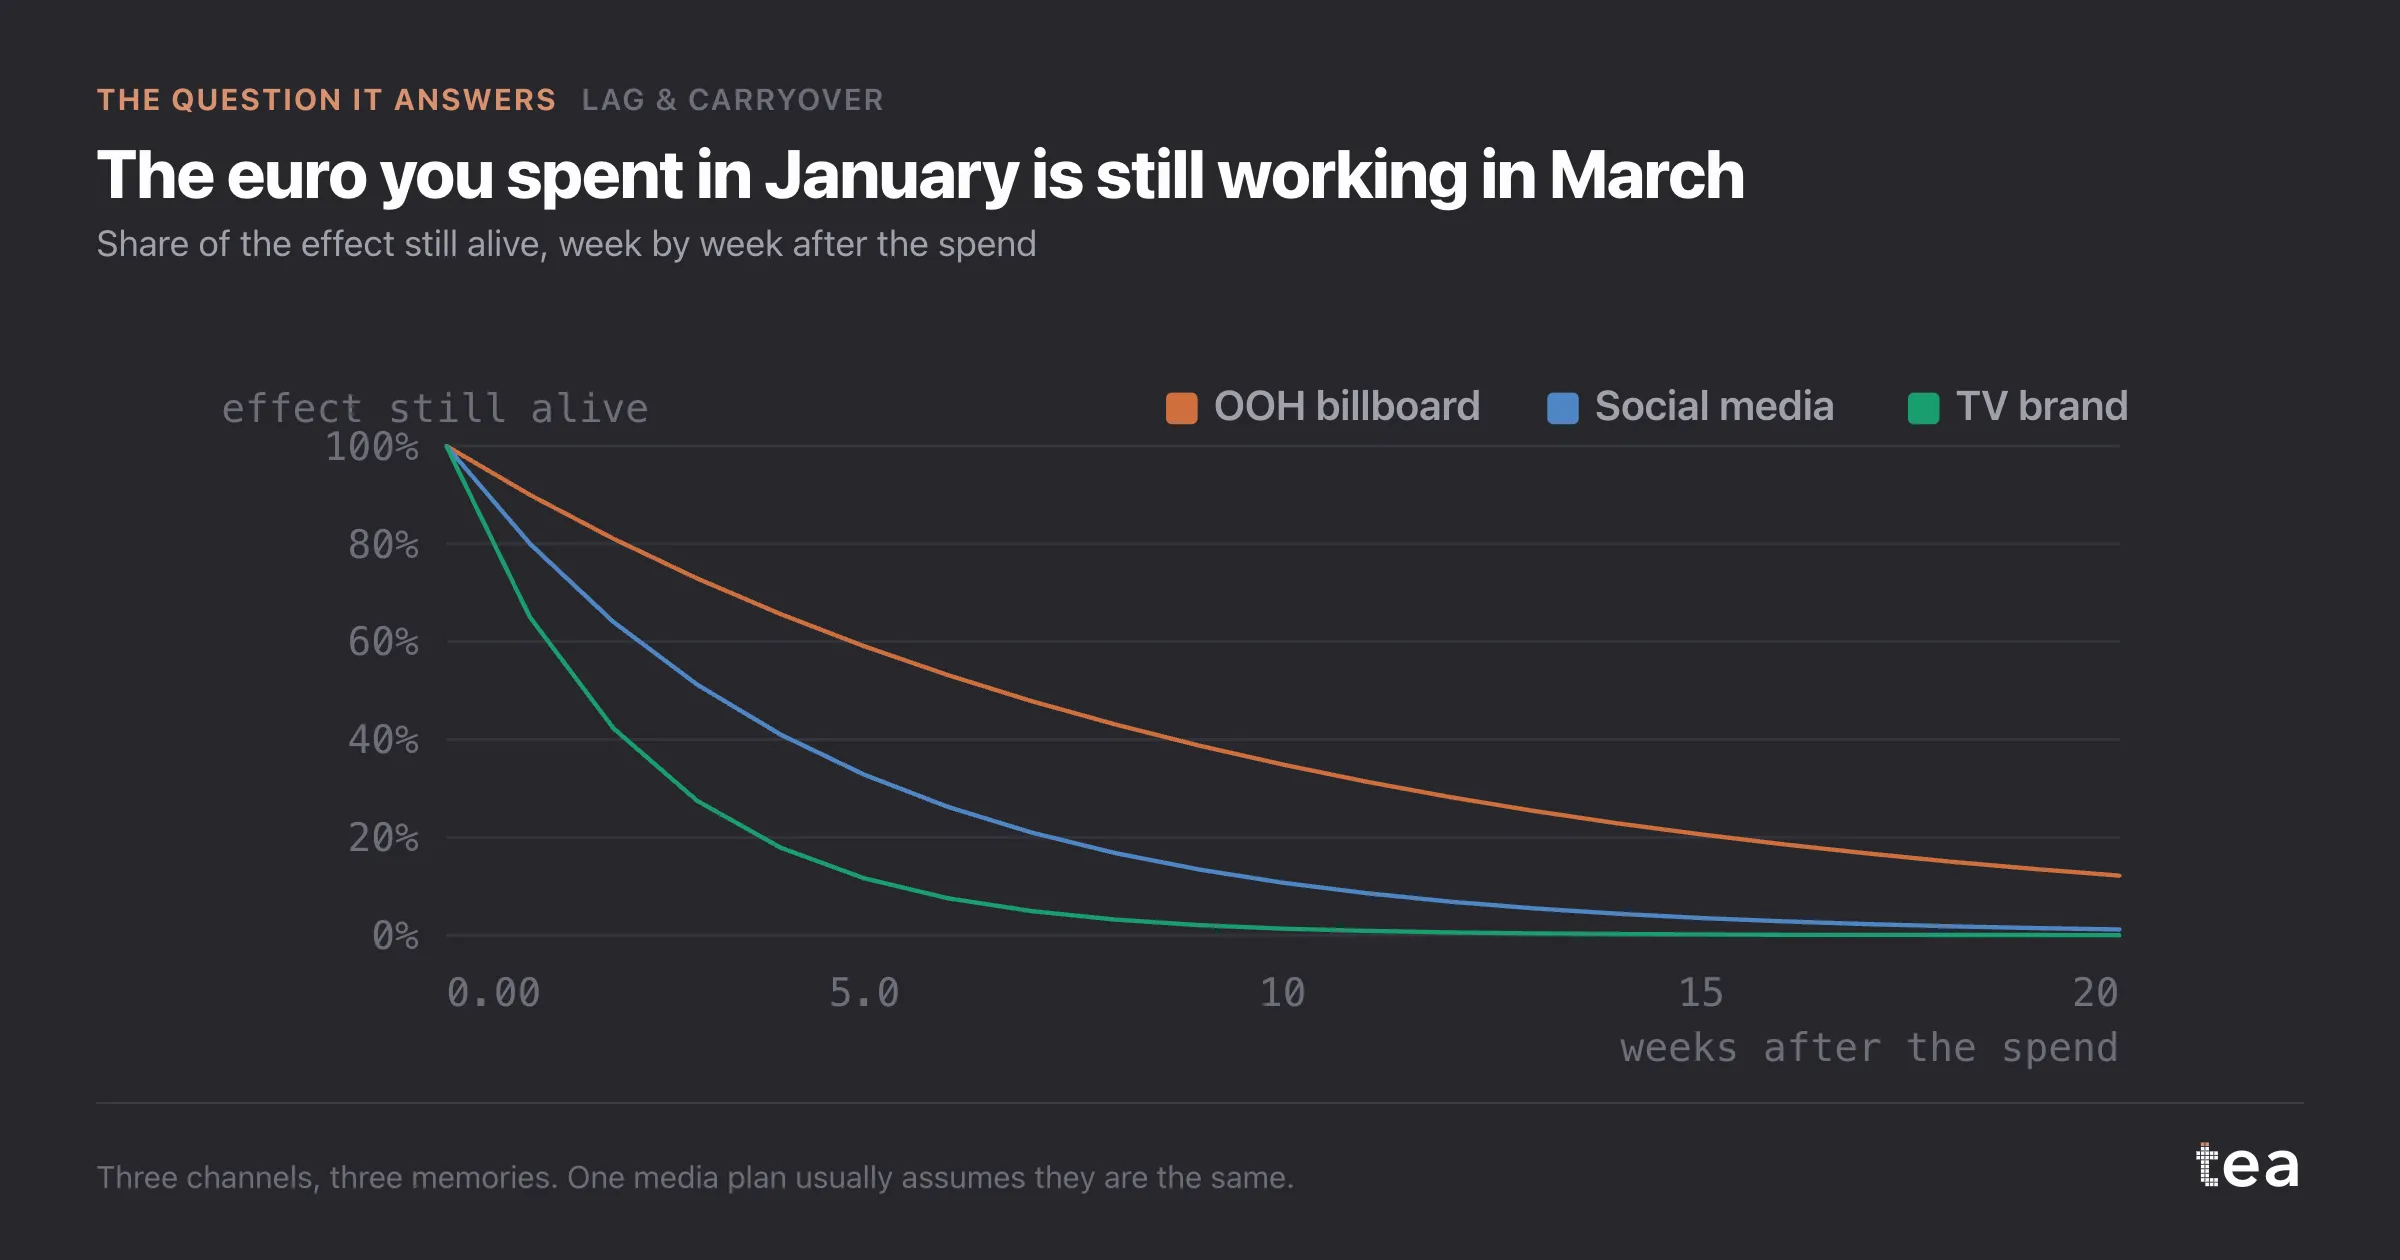
A caution, because half-life estimates are easy to over-read. These come with fit quality attached, and one of the four in this file is weak enough that the regime is reported as uncertain. Plan against the ones the data supports, and treat the weak ones as questions rather than parameters.
There is also a limit worth stating plainly. Carryover is not a licence for an infinite tail. Adstock decays geometrically, so the effect approaches zero and the model tells you when it is effectively there: 28 weeks for the longest channel here. Anyone claiming brand effects that never decay is not using this chart.
Take the four numbers into the next planning meeting. They will settle more arguments than another round of benchmarks.
The version of this that survives contact with reality is a small table: channel, half-life, 95% window, fit quality. Four rows, four columns, pinned wherever the plan gets built. It answers the flight question, the reporting question and the sequencing question without anyone rerunning anything.
And when a new channel arrives with no history, the honest move is to say the decay is unknown and plan it as if it were short, then refit once there are enough weeks to estimate it. An assumed carryover on a new channel is the fastest way to give it credit for the season it launched in.
The chart is the actual output of Lag & Carryover Analysis in TEA, run on a sample file anyone can download.
tea, the product
Your file, this question
Fifteen analyses on a CSV of weekly data, with the intervals and the diagnostics shown, and a plain sentence when the data cannot answer. Free while in beta, by invitation.
Request a place in the beta→tea, the product
Fifteen econometric analyses on your own CSV: Lag & Carryover, saturation curves, elasticities, budget allocation. Intervals and diagnostics shown, and a plain sentence when the file cannot answer.
Free while in beta, by invitation.
Request a place in the beta →Liked this? Run it on your own data.
tea runs Lag & Carryover and fourteen other analyses on any weekly CSV, in minutes. Free while in beta, by invitation.