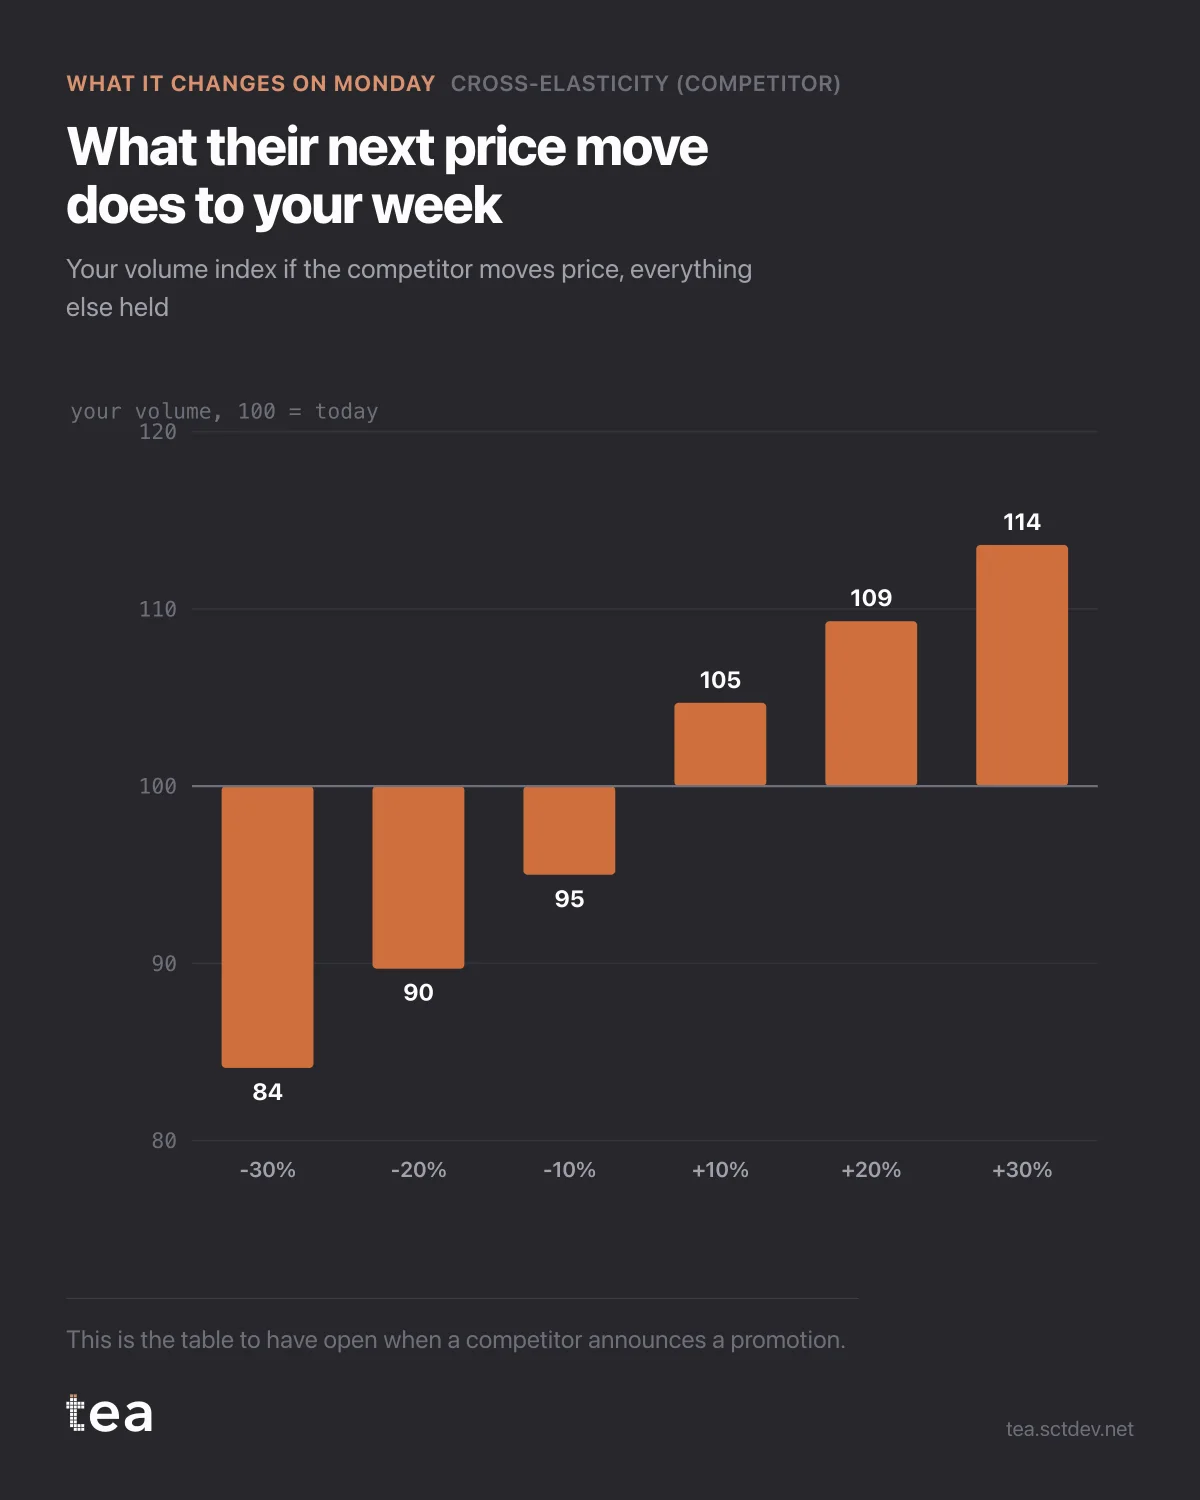
This is the table to have open when a competitor announces a promotion, and it takes about a minute to read.
Your volume index if their price moves and you do nothing:
They cut 30%: you land at 84. They cut 20%: 90. They cut 10%: 95. They raise 10%: 105. They raise 20%: 109. They raise 30%: 114.
So a serious competitive discount costs you roughly a sixth of your volume, and no more than that, if you hold your price.
Now the decision. Matching a 20% cut costs you 20% of price on every unit you were going to sell anyway. Not matching costs you about 10% of volume. Which is worse depends on your margin, and it is arithmetic rather than instinct: at most realistic gross margins in this category, holding price is the cheaper outcome.
That conclusion is not universal, and the point is not that you should never match. The point is that the question has an answer, and most competitive responses are decided in a meeting without one.
Three things to check before using the table.
It holds everything else constant. If their cut comes with a distribution push or a media burst, the price effect is the part this model measures and the rest is not in the chart.
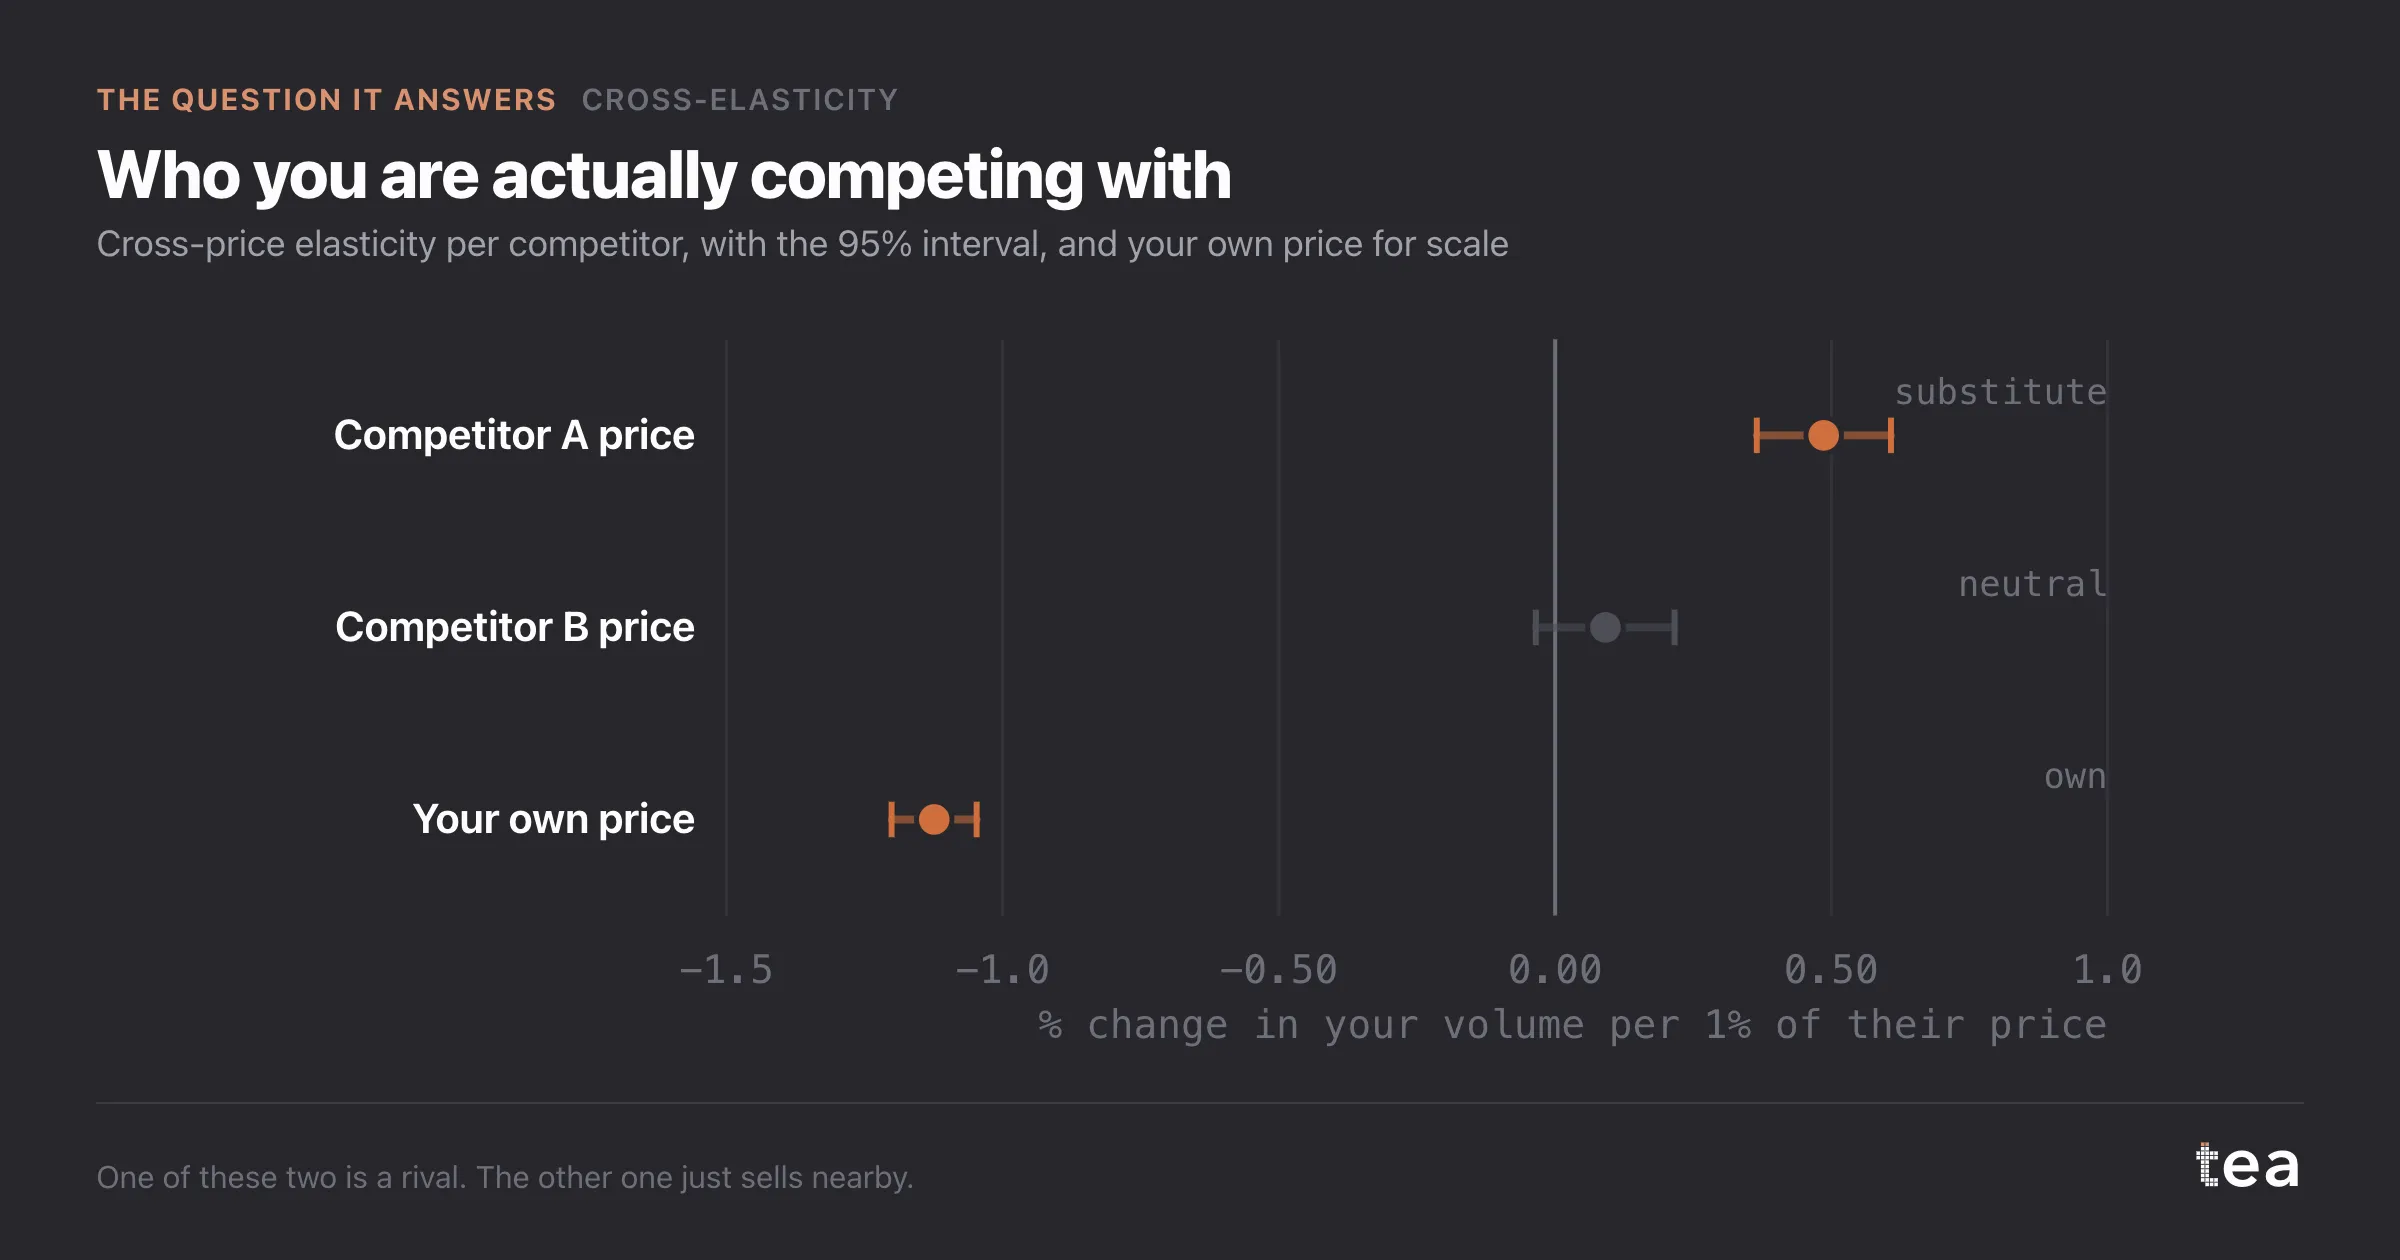
It is symmetric by construction, because it is a curve read in both directions. Real markets are not always symmetric: a cut may cost you more than the same rise gains you, and this specification cannot see that asymmetry.
And it is your volume, not your profit. Convert both columns to margin before anyone decides, because the two sides of the trade are in different units and that is precisely where competitive responses go wrong.
Have this table before the announcement, not after. The half life of a competitive decision is about a day, and a model produced on Thursday for a Tuesday decision is a post mortem.
One organisational point, because this is rarely a modelling problem. The table above is only useful if it exists before the phone rings, which means it belongs in a standing refresh rather than in a request queue.
A monthly refit, the same six rows, circulated to the people who take the call. That is the whole implementation, and it converts a competitive response from a reflex into a decision with a number behind it.
And keep the interval next to the volume column. A response justified by a point estimate that could have been half its size is a response that will be very hard to review honestly afterwards.
The chart is the actual output of Cross-Elasticity in TEA, run on a sample file anyone can download.
tea, the product
Your file, this question
Fifteen analyses on a CSV of weekly data, with the intervals and the diagnostics shown, and a plain sentence when the data cannot answer. Free while in beta, by invitation.
Request a place in the beta→tea, the product
Fifteen econometric analyses on your own CSV: Cross-Elasticity, saturation curves, elasticities, budget allocation. Intervals and diagnostics shown, and a plain sentence when the file cannot answer.
Free while in beta, by invitation.
Request a place in the beta →Liked this? Run it on your own data.
tea runs Cross-Elasticity and fourteen other analyses on any weekly CSV, in minutes. Free while in beta, by invitation.