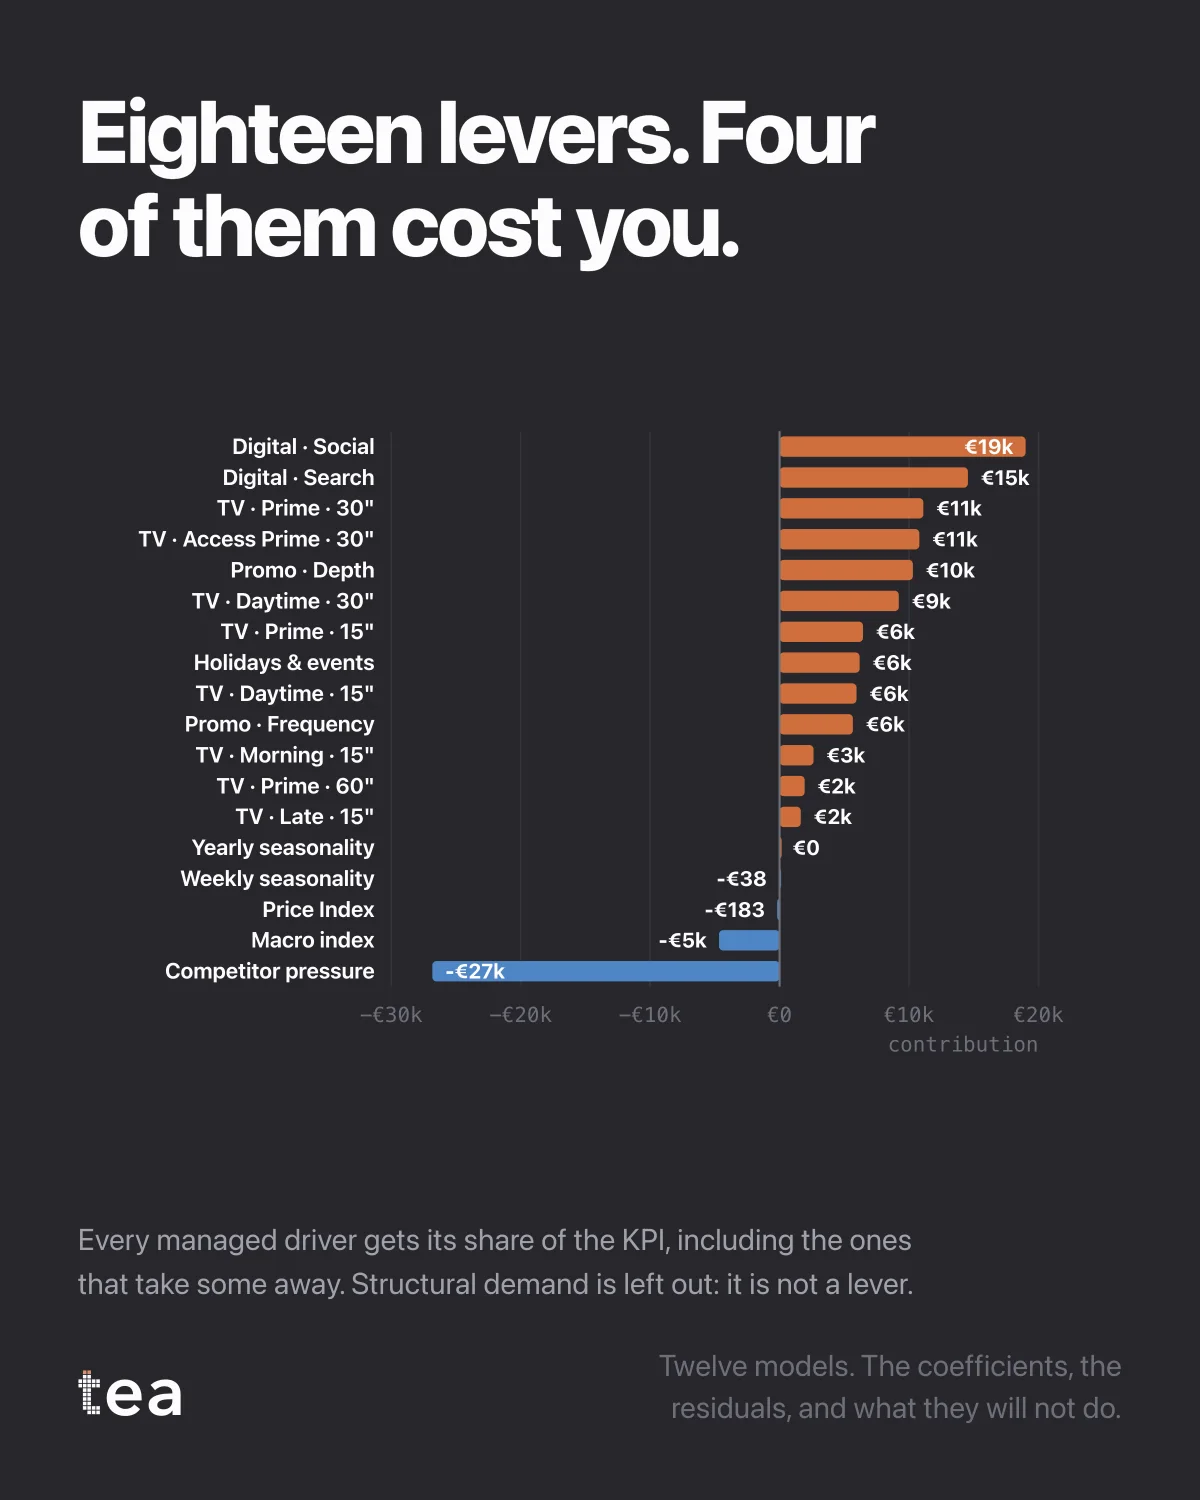
Eighteen levers. Four of them cost you.
Every managed driver in the demo dataset, sorted, in outcome units. The ones above the line added. The four below it took away, and they are shown at their real size rather than rounded to zero.
Structural demand is deliberately not in this picture. It is thirty times larger than the biggest lever and it is not something anybody pulls, so including it would compress every other bar into a line and teach you nothing.
Three properties of a decomposition worth insisting on, and they are the reason this chart looks the way it does.
Negative contributions stay negative. A model that constrains every driver to be positive will find a positive effect for everything, including the things that hurt, and it will pay for that by distorting the drivers next to them. Price pressure, competitor activity and badly timed promotions genuinely subtract, and a business that cannot see that is optimising blind.
The drivers are estimated jointly. Eighteen separate single-driver models would give eighteen numbers that sum to far more than the business, because each one would claim the credit for everything correlated with it.
And every bar has its working attached. Behind each one: the coefficient, its standard error, its p-value and its variance inflation factor. A bar whose interval crosses zero is drawn, and flagged, rather than quietly ranked among the winners.
The practical value shows up in the meetings this chart ends. Not "which channel wins", which is a question with a fashionable answer every two years, but "what is the size and the sign of each thing we do", which has an answer that changes with the business and can be checked.
Twelve models, the coefficients, the residuals, and what they will not do. This is what the first of them produces.
If you want a single test for whether a decomposition is worth reading, use this one: ask whether anything in it is negative. A chart where all eighteen drivers helped is not a lucky business, it is a constrained model, and the constraint has moved the truth somewhere you cannot see it.
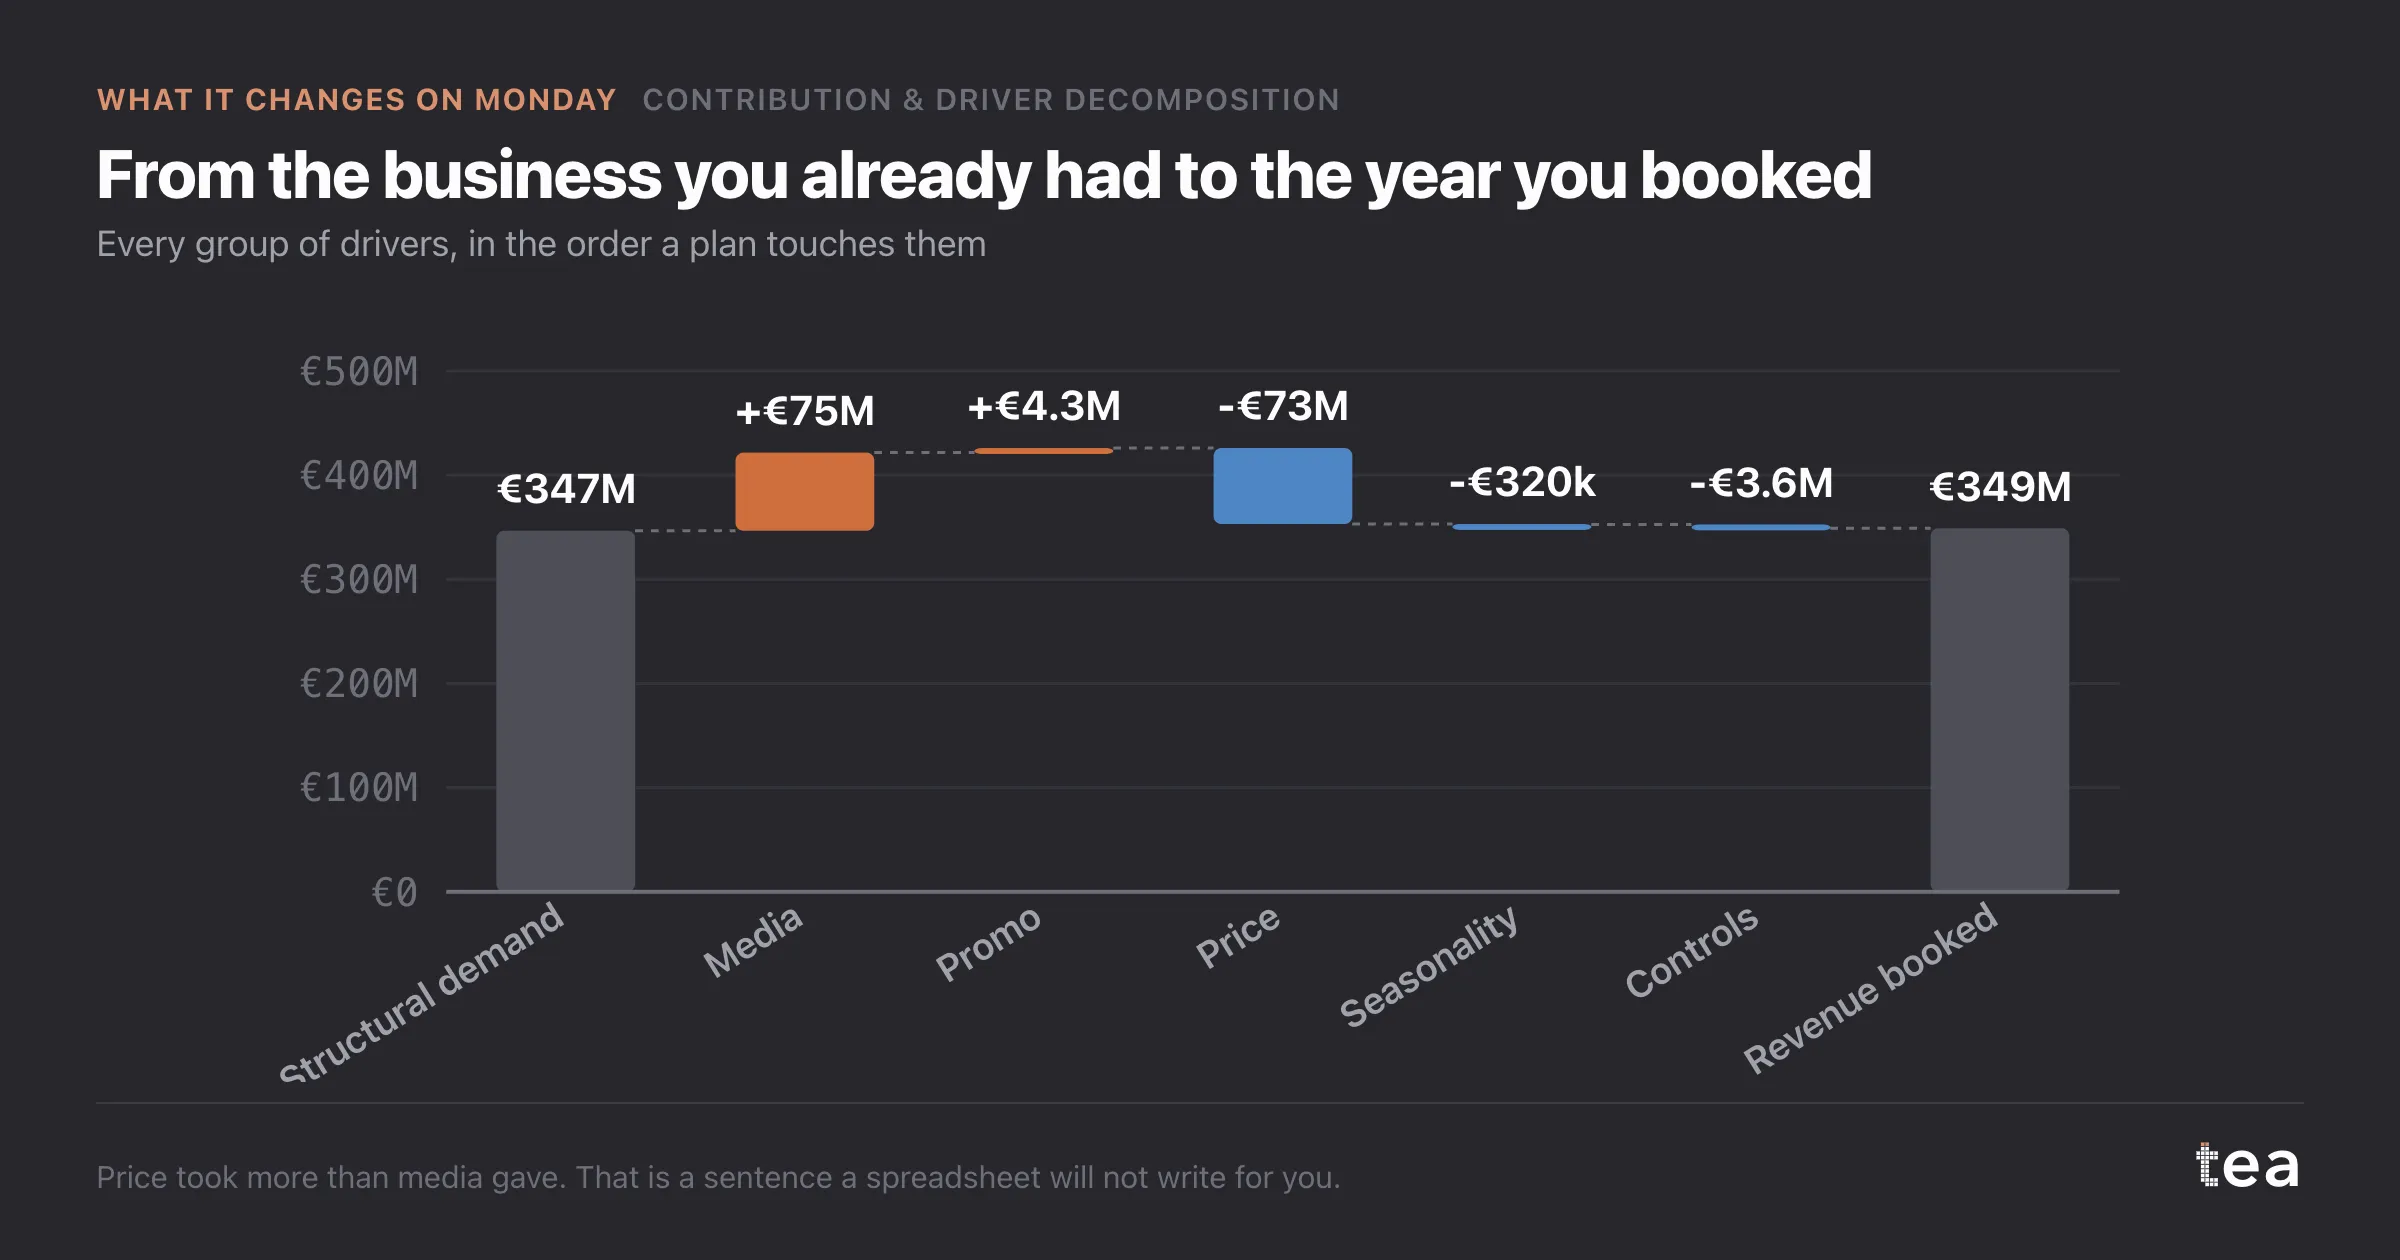
The second test is whether the contributions sum to the actual. Here they do, because the decomposition is built from the fitted model rather than assembled from separate studies. A set of driver contributions that adds up to more than the business has counted the same revenue twice, and somebody is about to make a budget decision with it.
tea, the product
Your file, this question
Fifteen analyses on a CSV of weekly data, with the intervals and the diagnostics shown, and a plain sentence when the data cannot answer. Free while in beta, by invitation.
Request a place in the beta→tea, the product
Fifteen econometric analyses on your own CSV: Contribution & Driver Decomposition, saturation curves, elasticities, budget allocation. Intervals and diagnostics shown, and a plain sentence when the file cannot answer.
Free while in beta, by invitation.
Request a place in the beta →Liked this? Run it on your own data.
tea runs Contribution & Driver Decomposition and fourteen other analyses on any weekly CSV, in minutes. Free while in beta, by invitation.