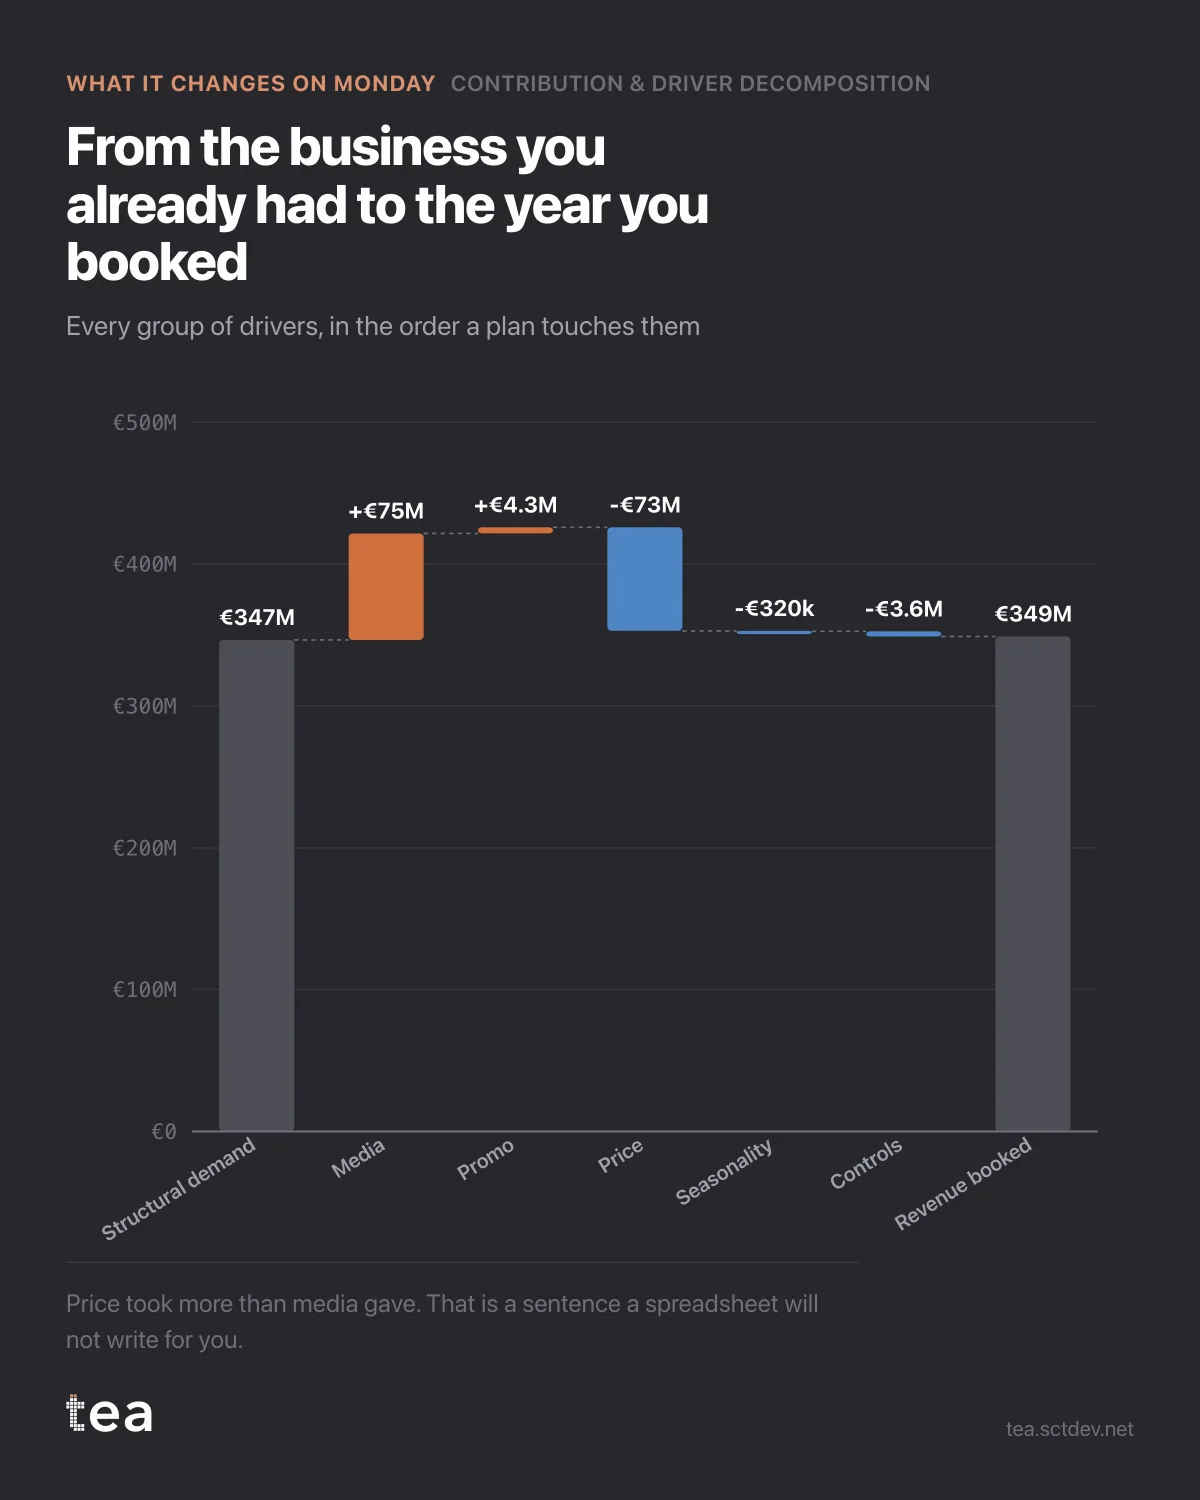
Here is the year in six bars, and the order is the order a plan actually touches things.
Structural demand: €346.6M. That is the business as it stands, before anyone does anything.
Media adds €75.1M. Promotion adds €4.3M. Price takes €73.0M. Seasonality and controls take a little more. The year closes at €349.0M.
Read it once and a strategy falls out of it.
Price took almost exactly what media gave. Whatever the marketing team achieved this year was spent, to the euro, on the price line. Nobody in either function would have described their year that way, because the two numbers have never been on the same chart.
That is the decision this analysis exists to support. Not "which channel wins", but "which lever is worth touching next", and the answer here is obviously not another round of channel optimisation. A 5% improvement in media efficiency is worth €3.8M. A 5% improvement on the price line is worth €3.7M, and it does not require a single extra euro of budget.
Three ways to use this chart on a Monday.
Put it in front of the people who do not work in marketing. It is the only view of the year that a finance director and a media planner can read at the same time, because it is in euros and it contains their levers side by side.
Use it to set the order of work. The biggest bar you can influence is where the next quarter goes. Everything else is tuning.
And use it to defend the flat year. A business that looks static from the outside can be two very large forces cancelling out. If nobody has drawn them, the marketing budget is the one that gets cut, because it is the one with an invoice attached.
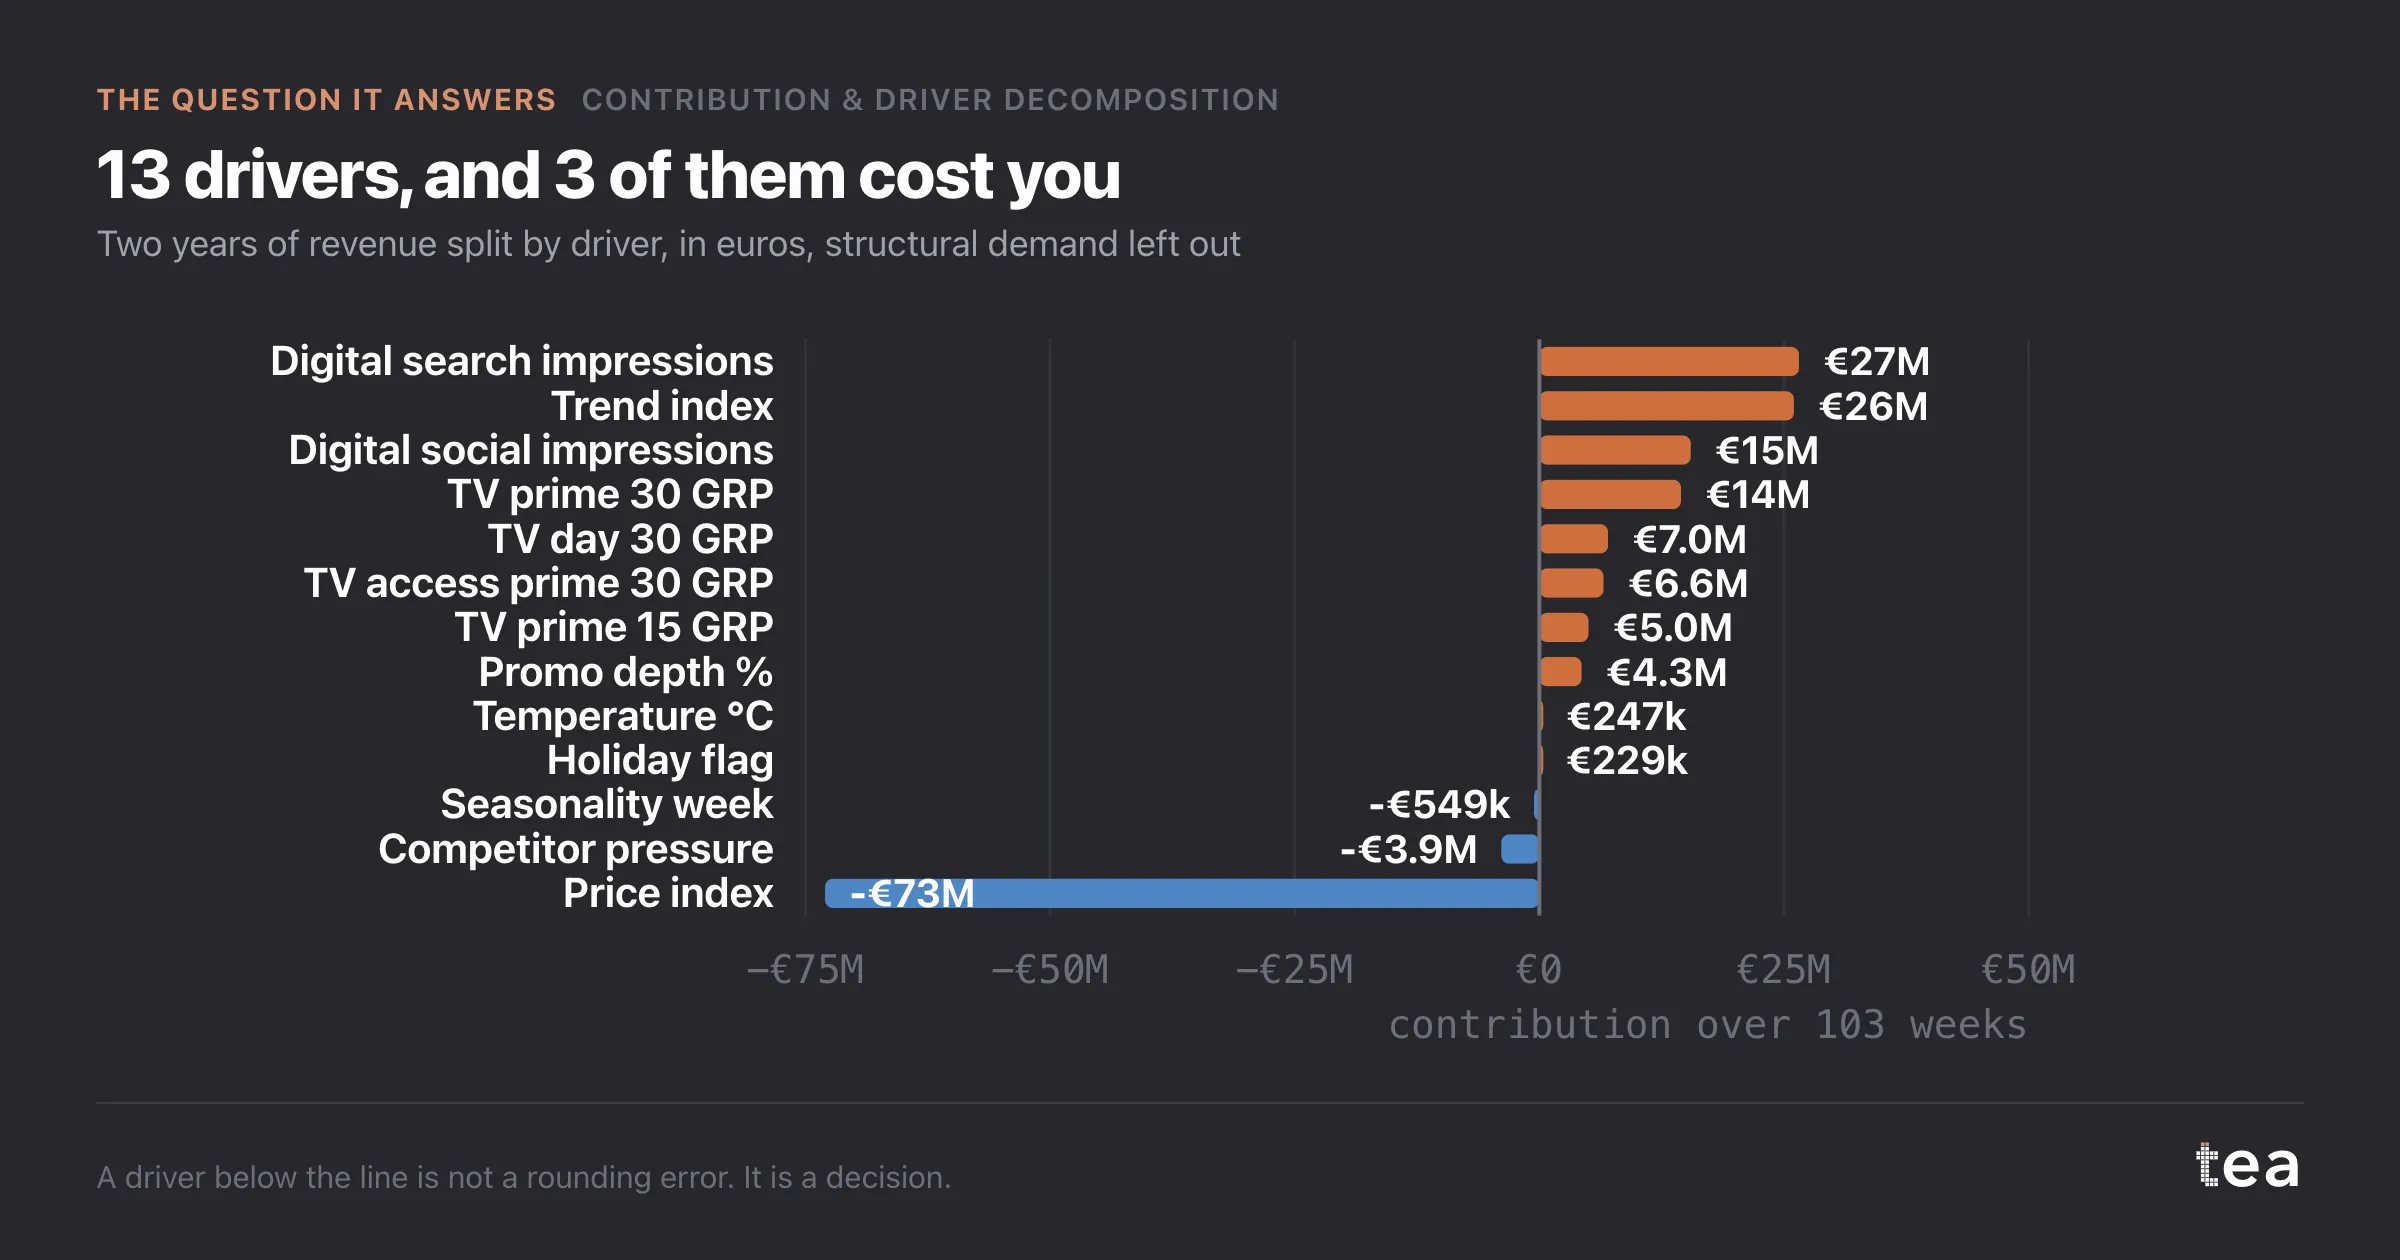
One caution: the media bar is a total, and totals hide the variation inside them. The per driver view and the coefficient table sit behind this one for that reason.
There is one more line that comes free with this view, and it changes how the year is described. Media contributed 21.5% of total revenue here. Not 21.5% growth, not 21.5% of the increase: 21.5% of everything, with the other four fifths coming from a business that exists whether or not the plan runs.
That proportion is usually a surprise in both directions. It is smaller than marketing hopes and much larger than finance assumes, and having it on a chart in euros ends a specific argument that otherwise repeats every year at budget time.
The other habit this supports is a quarterly refit rather than an annual one. Price moves, competitor pressure and promotion depth all shift faster than a yearly study can follow, and a decomposition that is six months old is describing a business that has already changed.
The chart is the actual output of Contribution & Driver Decomposition in TEA, run on a sample file anyone can download.
tea, the product
Your file, this question
Fifteen analyses on a CSV of weekly data, with the intervals and the diagnostics shown, and a plain sentence when the data cannot answer. Free while in beta, by invitation.
Request a place in the beta→tea, the product
Fifteen econometric analyses on your own CSV: Contribution & Driver Decomposition, saturation curves, elasticities, budget allocation. Intervals and diagnostics shown, and a plain sentence when the file cannot answer.
Free while in beta, by invitation.
Request a place in the beta →Liked this? Run it on your own data.
tea runs Contribution & Driver Decomposition and fourteen other analyses on any weekly CSV, in minutes. Free while in beta, by invitation.