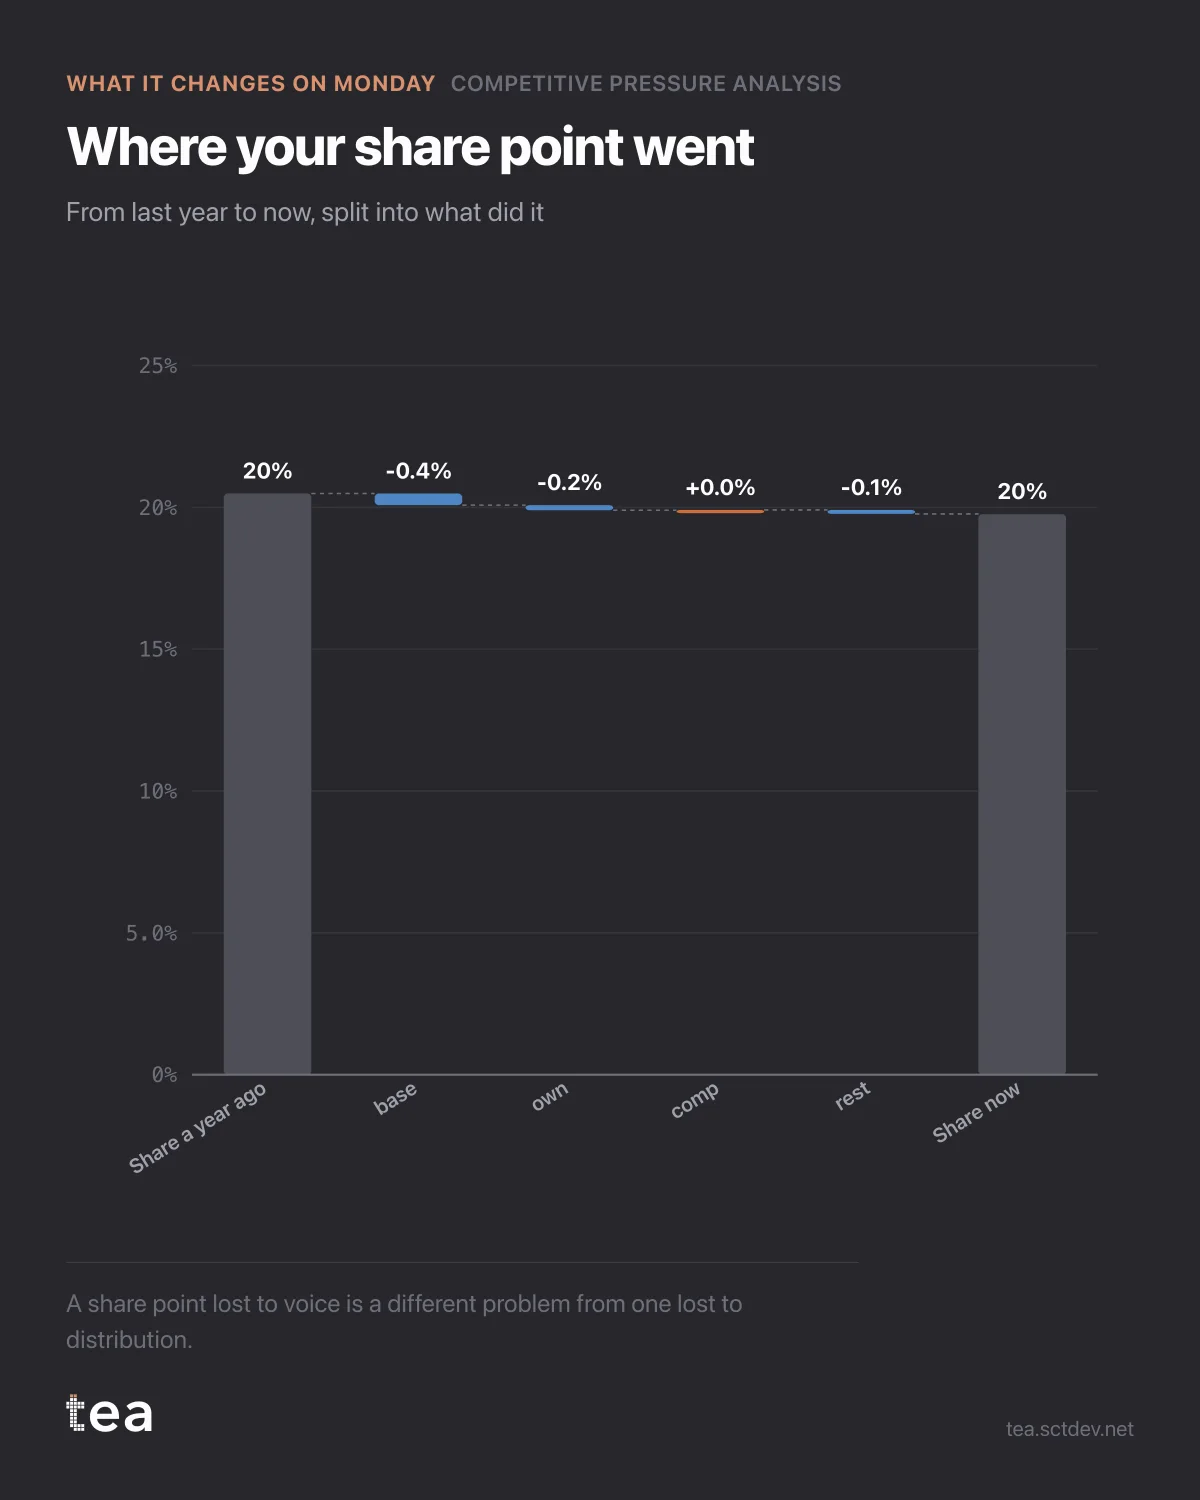
A share point went missing. This is where it went, and the answer is in parts rather than in one blame.
The waterfall starts at last year's share and ends at today's, with the steps between them separated: what the category's spending did to you, what your own voice did, and what is left over for everything that is not media.
The brand loses 0.73 points over the year, from 20.49 to 19.76.
Why the split matters more than the total: a share point lost to voice and a share point lost to distribution are different problems with different owners, different costs and different time to fix. Merging them into a single number guarantees the wrong meeting.
If the loss is mostly voice, it is a budget question, and the size of the answer is on the previous chart: holding position in this category now costs more than twice the current spend. That is a real number to take to a board, and it is also a real decision to decline, as long as the decline is made knowingly.
If the loss is mostly the residual, media is not the story. Something in distribution, pricing, availability or product has moved, and increasing media spend in response is the most expensive way to not fix it.
Two cautions before anyone acts.
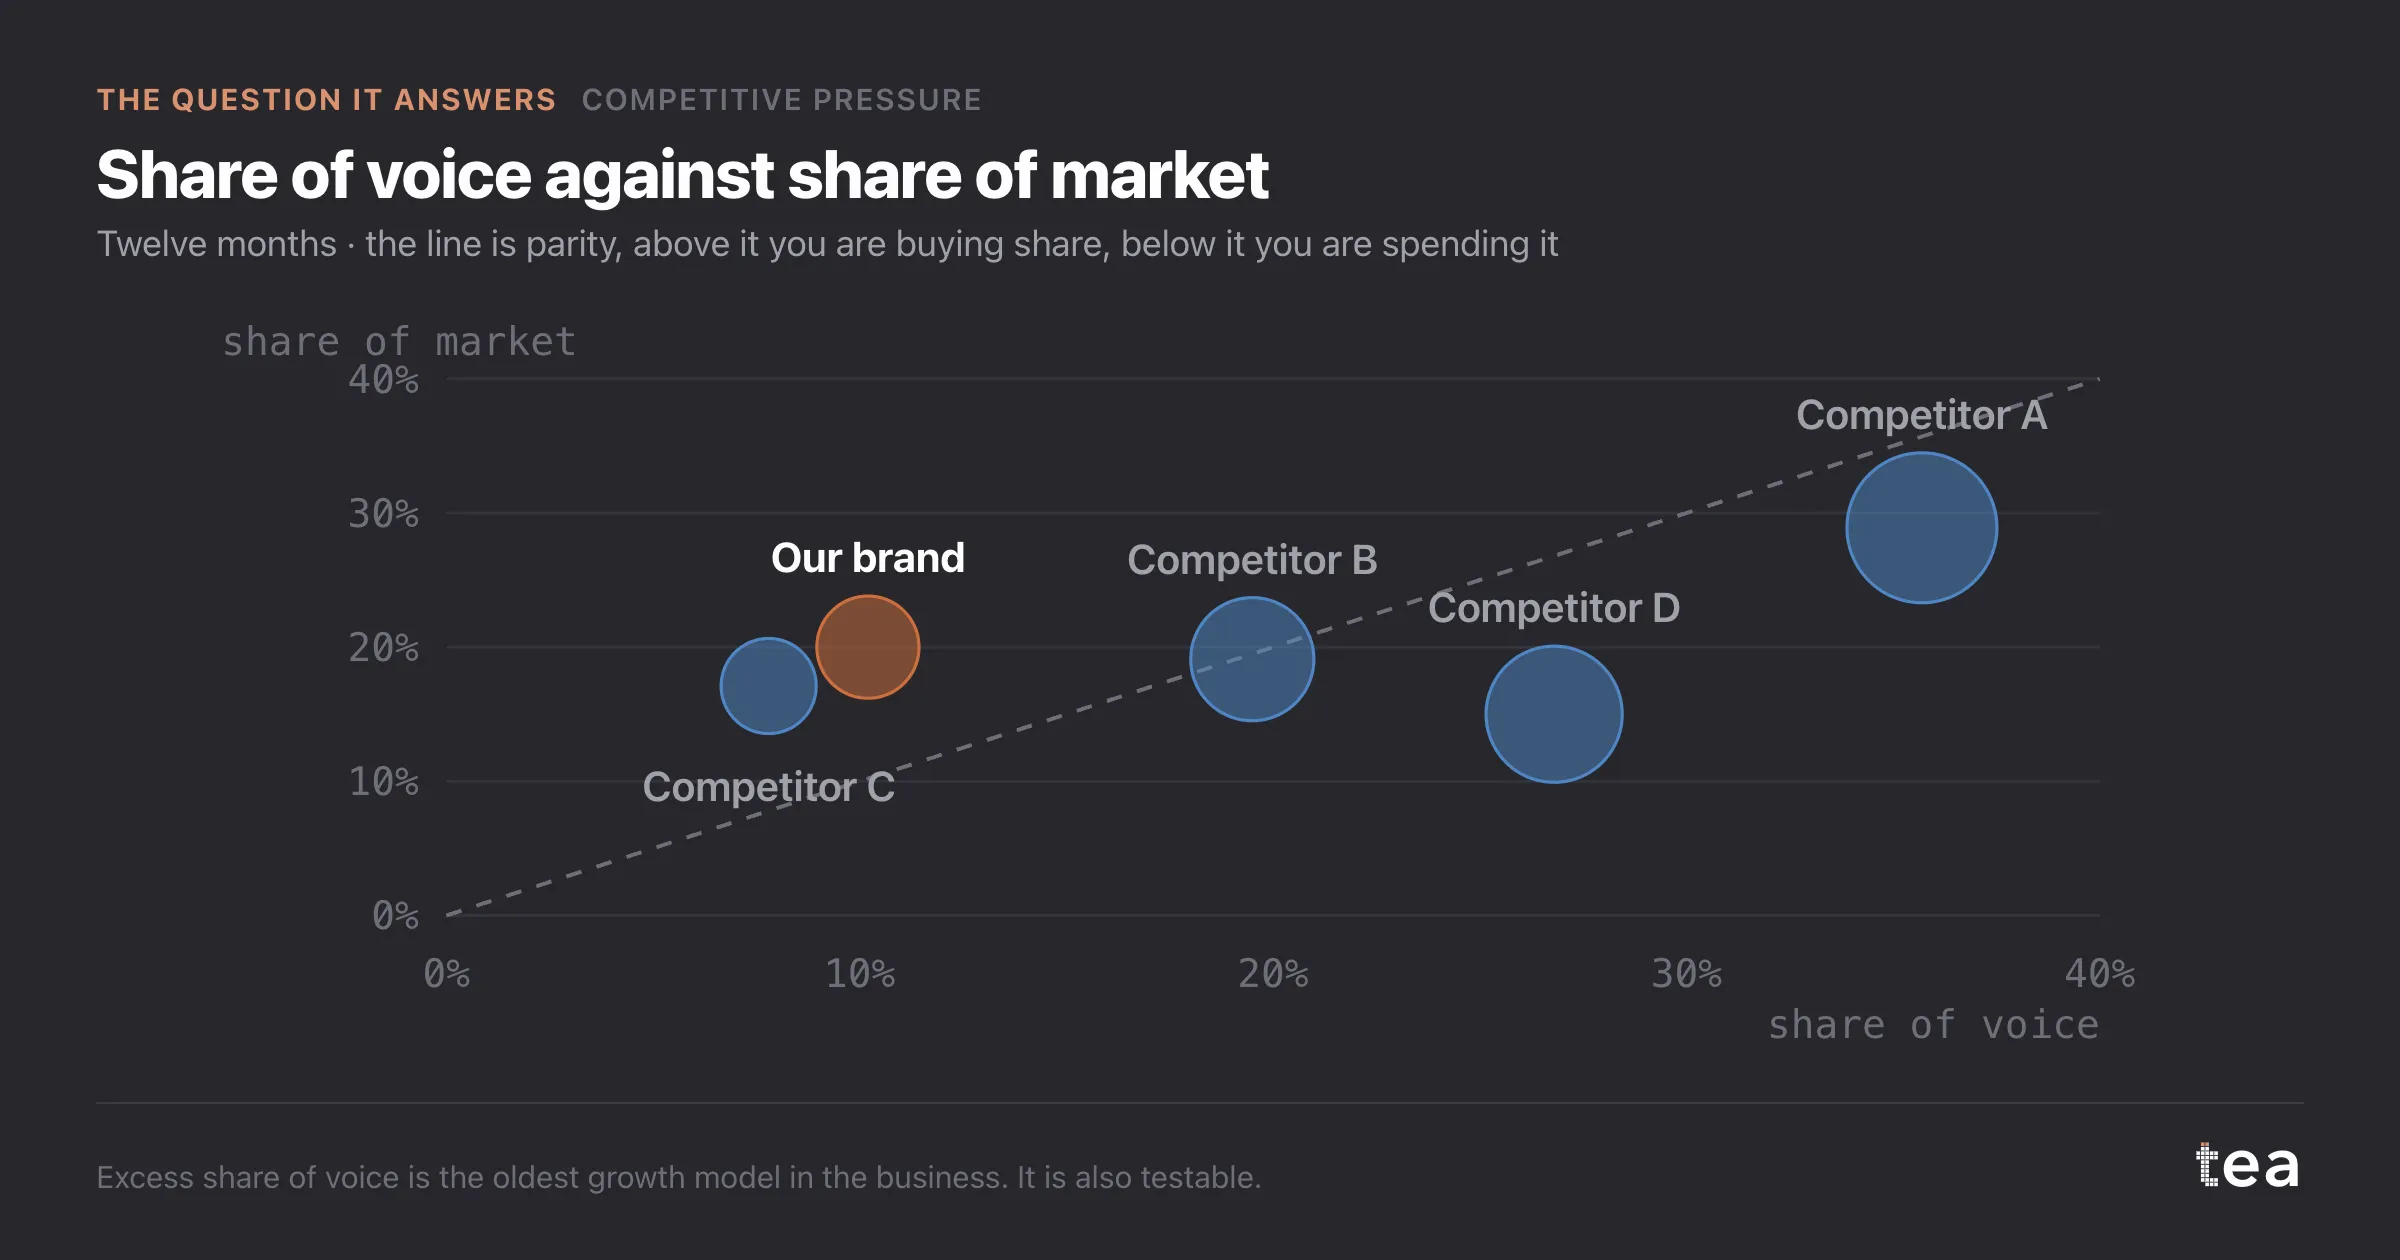
The decomposition is as good as the competitive spend data feeding it, which is estimated rather than observed.
And a year is a short window for a share story. This file has 36 months behind it, which is enough to fit the relationship but not enough to call a trend on any single brand.
The reason to run this analysis at all is that share loss is usually discussed as a mood. Someone notices the number is down, everyone offers a theory, and the theory with the strongest advocate wins. A waterfall with a fitted model behind it does not settle everything, and it does put the theories in a size order.
That is usually enough to change what the room decides to do next.
A note on how to present the waterfall. Keep the residual step visible and labelled, even when it is the largest one. The temptation is to relabel it as something specific, and a bar called "other" that is bigger than the media effect is a much more honest object than four confident small bars that add up to the same thing.
And run it from the competitor's side once. Reading the same chart as Competitor D, who spends 26.8% of the category's voice on 15.0% of its market, is the fastest way to understand what your own position looks like from outside, and what they are likely to do next.
The chart is the actual output of Competitive Pressure Analysis in TEA, run on a sample file anyone can download.
tea, the product
Your file, this question
Fifteen analyses on a CSV of weekly data, with the intervals and the diagnostics shown, and a plain sentence when the data cannot answer. Free while in beta, by invitation.
Request a place in the beta→tea, the product
Fifteen econometric analyses on your own CSV: Competitive Pressure, saturation curves, elasticities, budget allocation. Intervals and diagnostics shown, and a plain sentence when the file cannot answer.
Free while in beta, by invitation.
Request a place in the beta →Liked this? Run it on your own data.
tea runs Competitive Pressure and fourteen other analyses on any weekly CSV, in minutes. Free while in beta, by invitation.