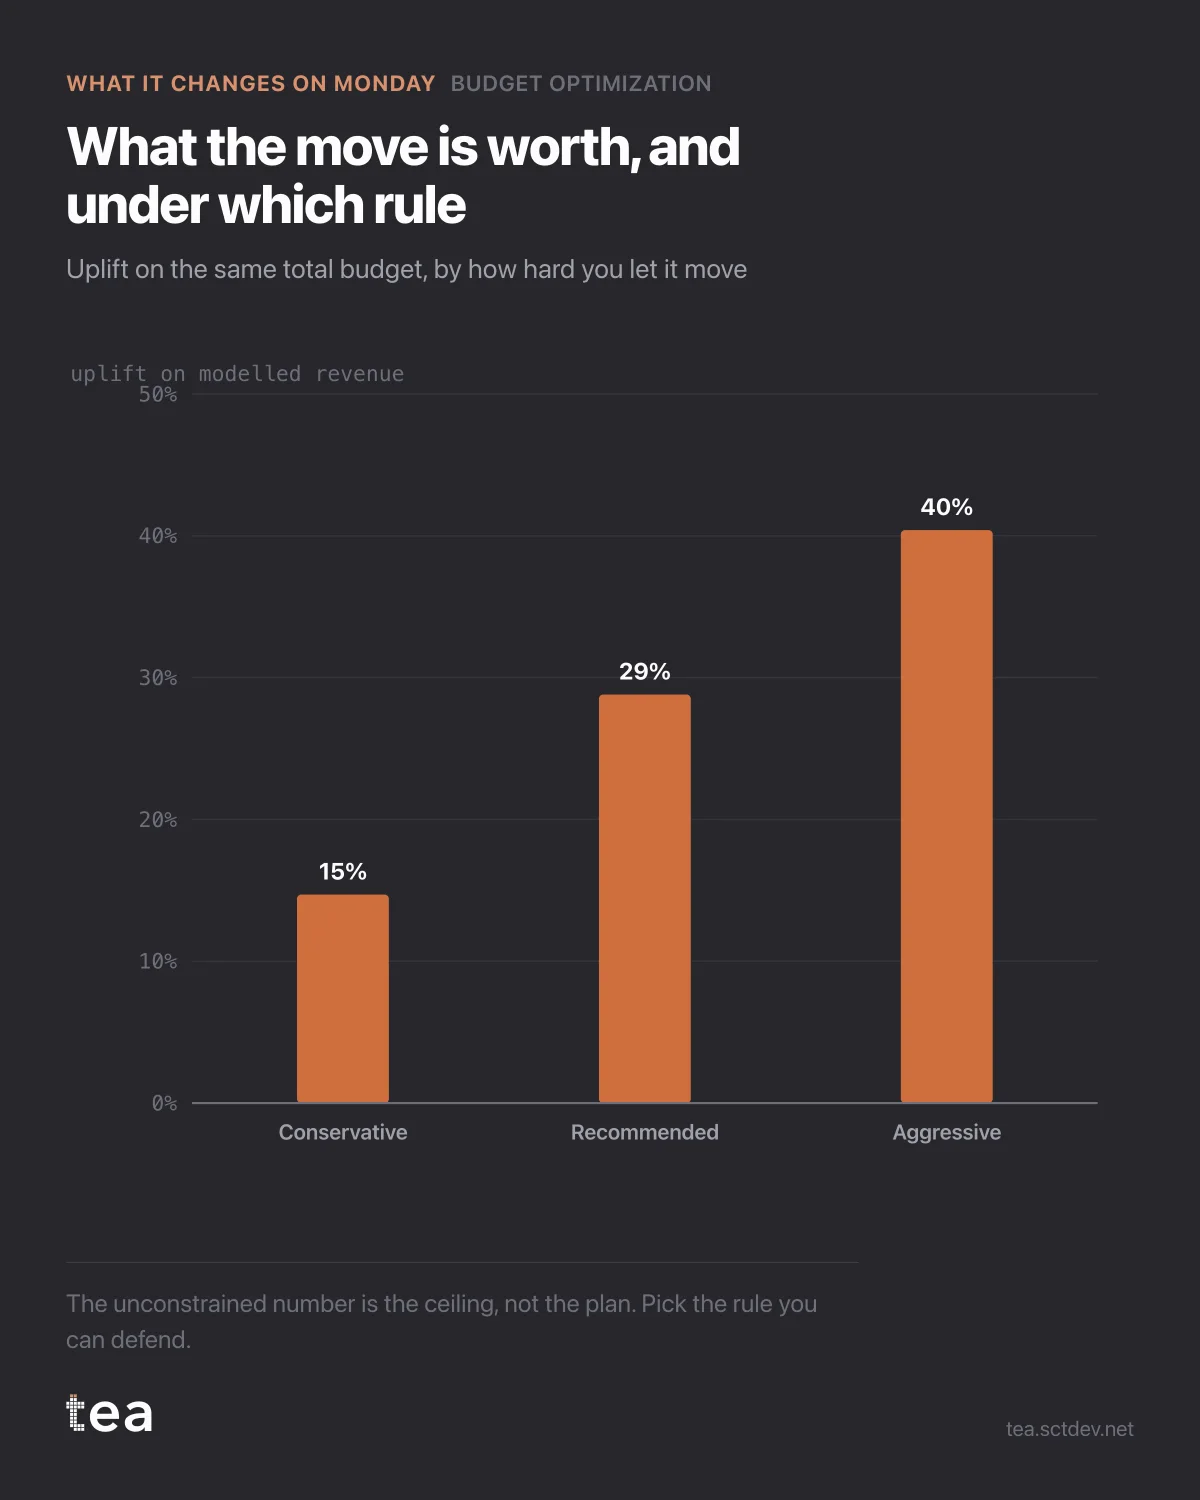
Three numbers, three rules, one budget. This is the chart that decides how much of the model's advice you are actually going to take.
Conservative: 14.7% uplift. Recommended: 28.8%. Aggressive: 40.0%.
The temptation is to read the last one as the answer and the first two as timidity. It is the other way round.
The aggressive number comes from letting money move as far as the curves allow. Every euro of that extra uplift is bought by pushing channels into regions where you have less evidence, and where a fitted curve is an extrapolation rather than a summary. The 40% is a ceiling, not a plan.
The conservative number caps how far any single channel can move. It buys less, and almost all of it is inside the range the data has actually seen.
So the real decision is not which number is biggest. It is how much of your plan you are willing to place on the least observed part of the model, and that is a question about your risk appetite, not about the arithmetic.
How to choose in practice:
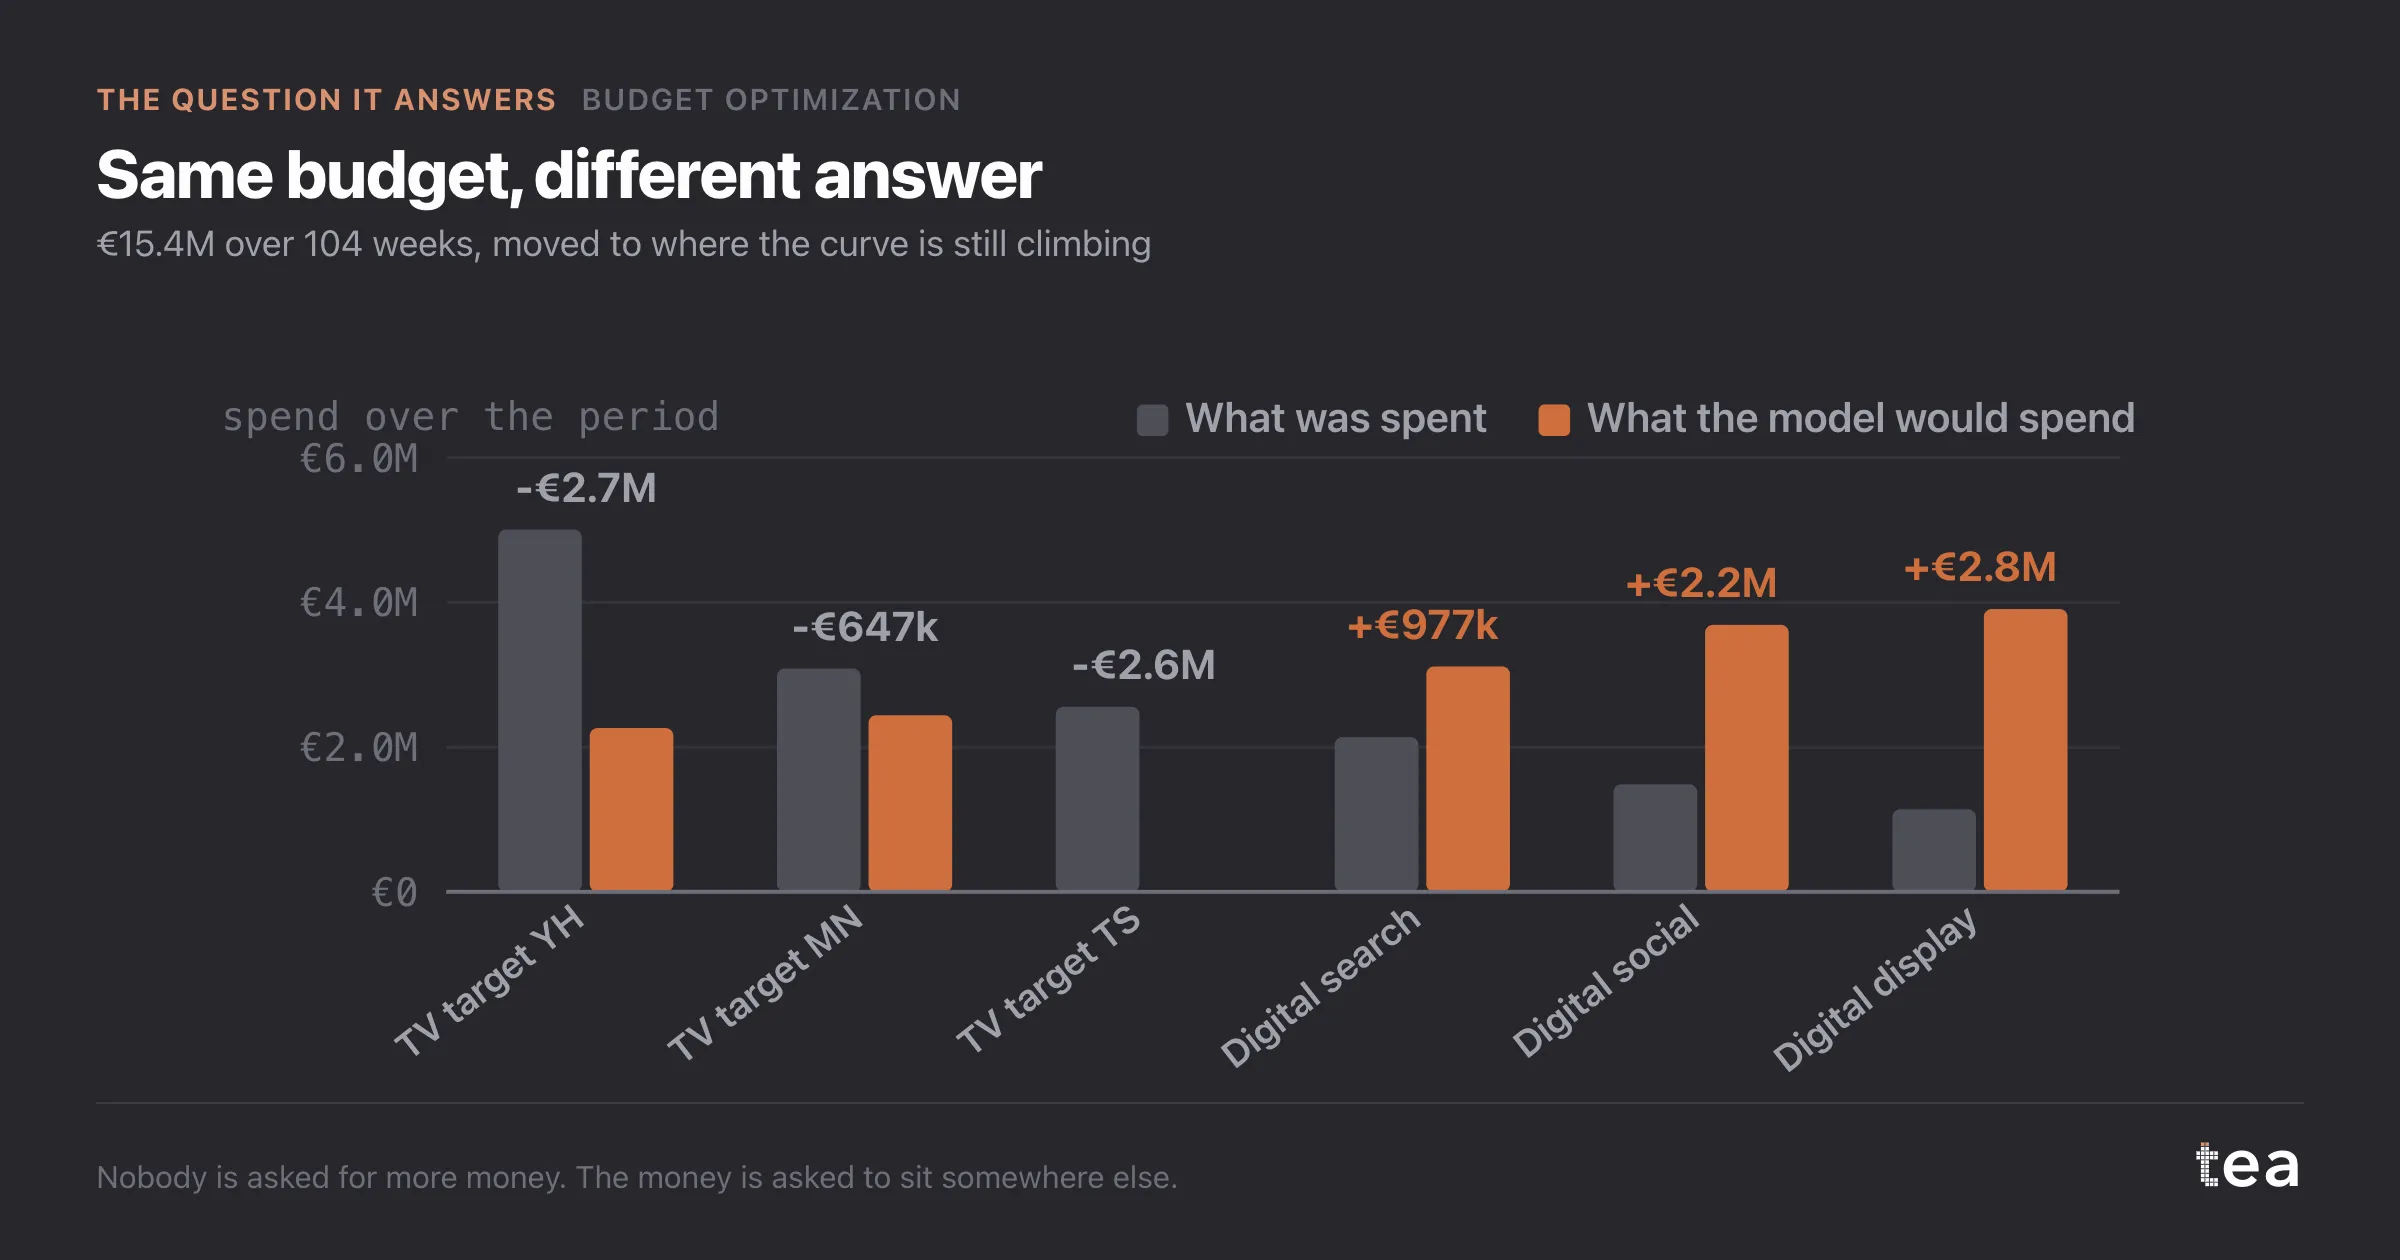
If the response curves are tight and the moves stay inside historical spend ranges, take the recommended plan. That is the case this file is in for the digital channels.
If a channel needs to triple to reach its recommended spend, treat the move as a test rather than a plan. Step it over two quarters and refit in between, because the second fit will be estimated on the new range and will tell you whether the curve held.
And if the uplift only appears in the aggressive variant, you have not found an opportunity, you have found the edge of what your data supports.
The conversation this chart is built for is the one where someone asks for the number. Give them all three, with the rule attached to each. A single percentage without its constraint is how a modelled ceiling becomes a committed target, and that is a bad quarter waiting to happen.
One more practical habit. Write down the three numbers and the rule that produced each, and keep them with the plan. Six months later nobody remembers which variant was agreed, and the aggressive figure has a way of surviving in a slide while the conservative plan is the one that ran.
And when the quarter closes, compare the realised uplift against the variant you actually executed rather than against the headline. That is the only comparison that tells you whether the curves were right, and it is the one that makes the next refit worth trusting.
The chart is the actual output of Budget Optimization in TEA, run on a sample file anyone can download.
tea, the product
Your file, this question
Fifteen analyses on a CSV of weekly data, with the intervals and the diagnostics shown, and a plain sentence when the data cannot answer. Free while in beta, by invitation.
Request a place in the beta→tea, the product
Fifteen econometric analyses on your own CSV: Budget Optimization, saturation curves, elasticities, budget allocation. Intervals and diagnostics shown, and a plain sentence when the file cannot answer.
Free while in beta, by invitation.
Request a place in the beta →Liked this? Run it on your own data.
tea runs Budget Optimization and fourteen other analyses on any weekly CSV, in minutes. Free while in beta, by invitation.