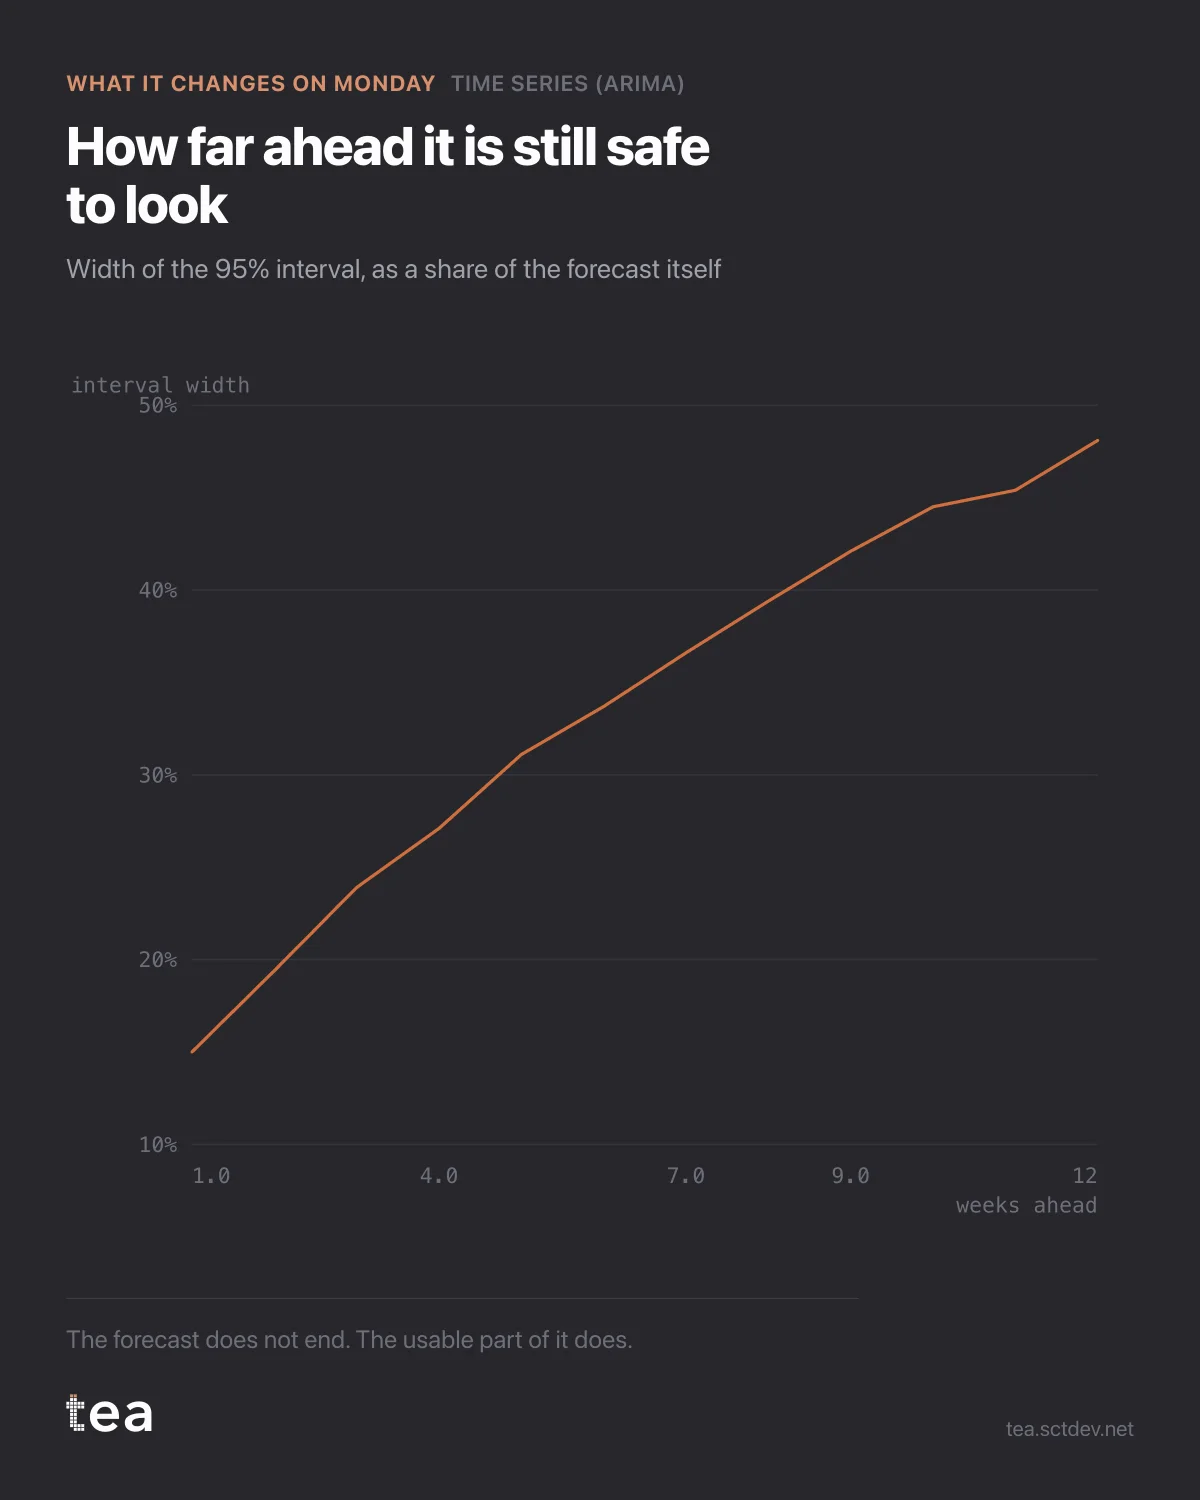
Every forecast has a horizon where it stops being useful. This chart is how you find yours.
It plots the width of the 95% interval as a share of the forecast itself, week by week.
Week one: the interval spans 15% of the number. Week twelve: 48%.
Read that again as a planning statement. Twelve weeks out, the honest range is roughly plus or minus a quarter of the value. Any decision that needs more precision than that is not being supported by this model, whatever the line in the middle says.
The widening is not a flaw. It is the model being correct about uncertainty compounding: each step forward inherits the error of the step before, plus its own. A forecast whose interval does not widen with the horizon is a forecast that has stopped modelling and started drawing.
What to do with it:
Match the decision to the width. A weekly stock order or a media flight starting Monday lives in the 15% zone. An annual budget does not live on this chart at all, and pretending otherwise is how a plan built on week-forty-eight of a twelve-week forecast ends up in a board pack.
Set the review cadence from the curve rather than from the calendar. If the band doubles by week eight, the plan gets revisited at week eight, not at the quarter end because that is when the meeting is.
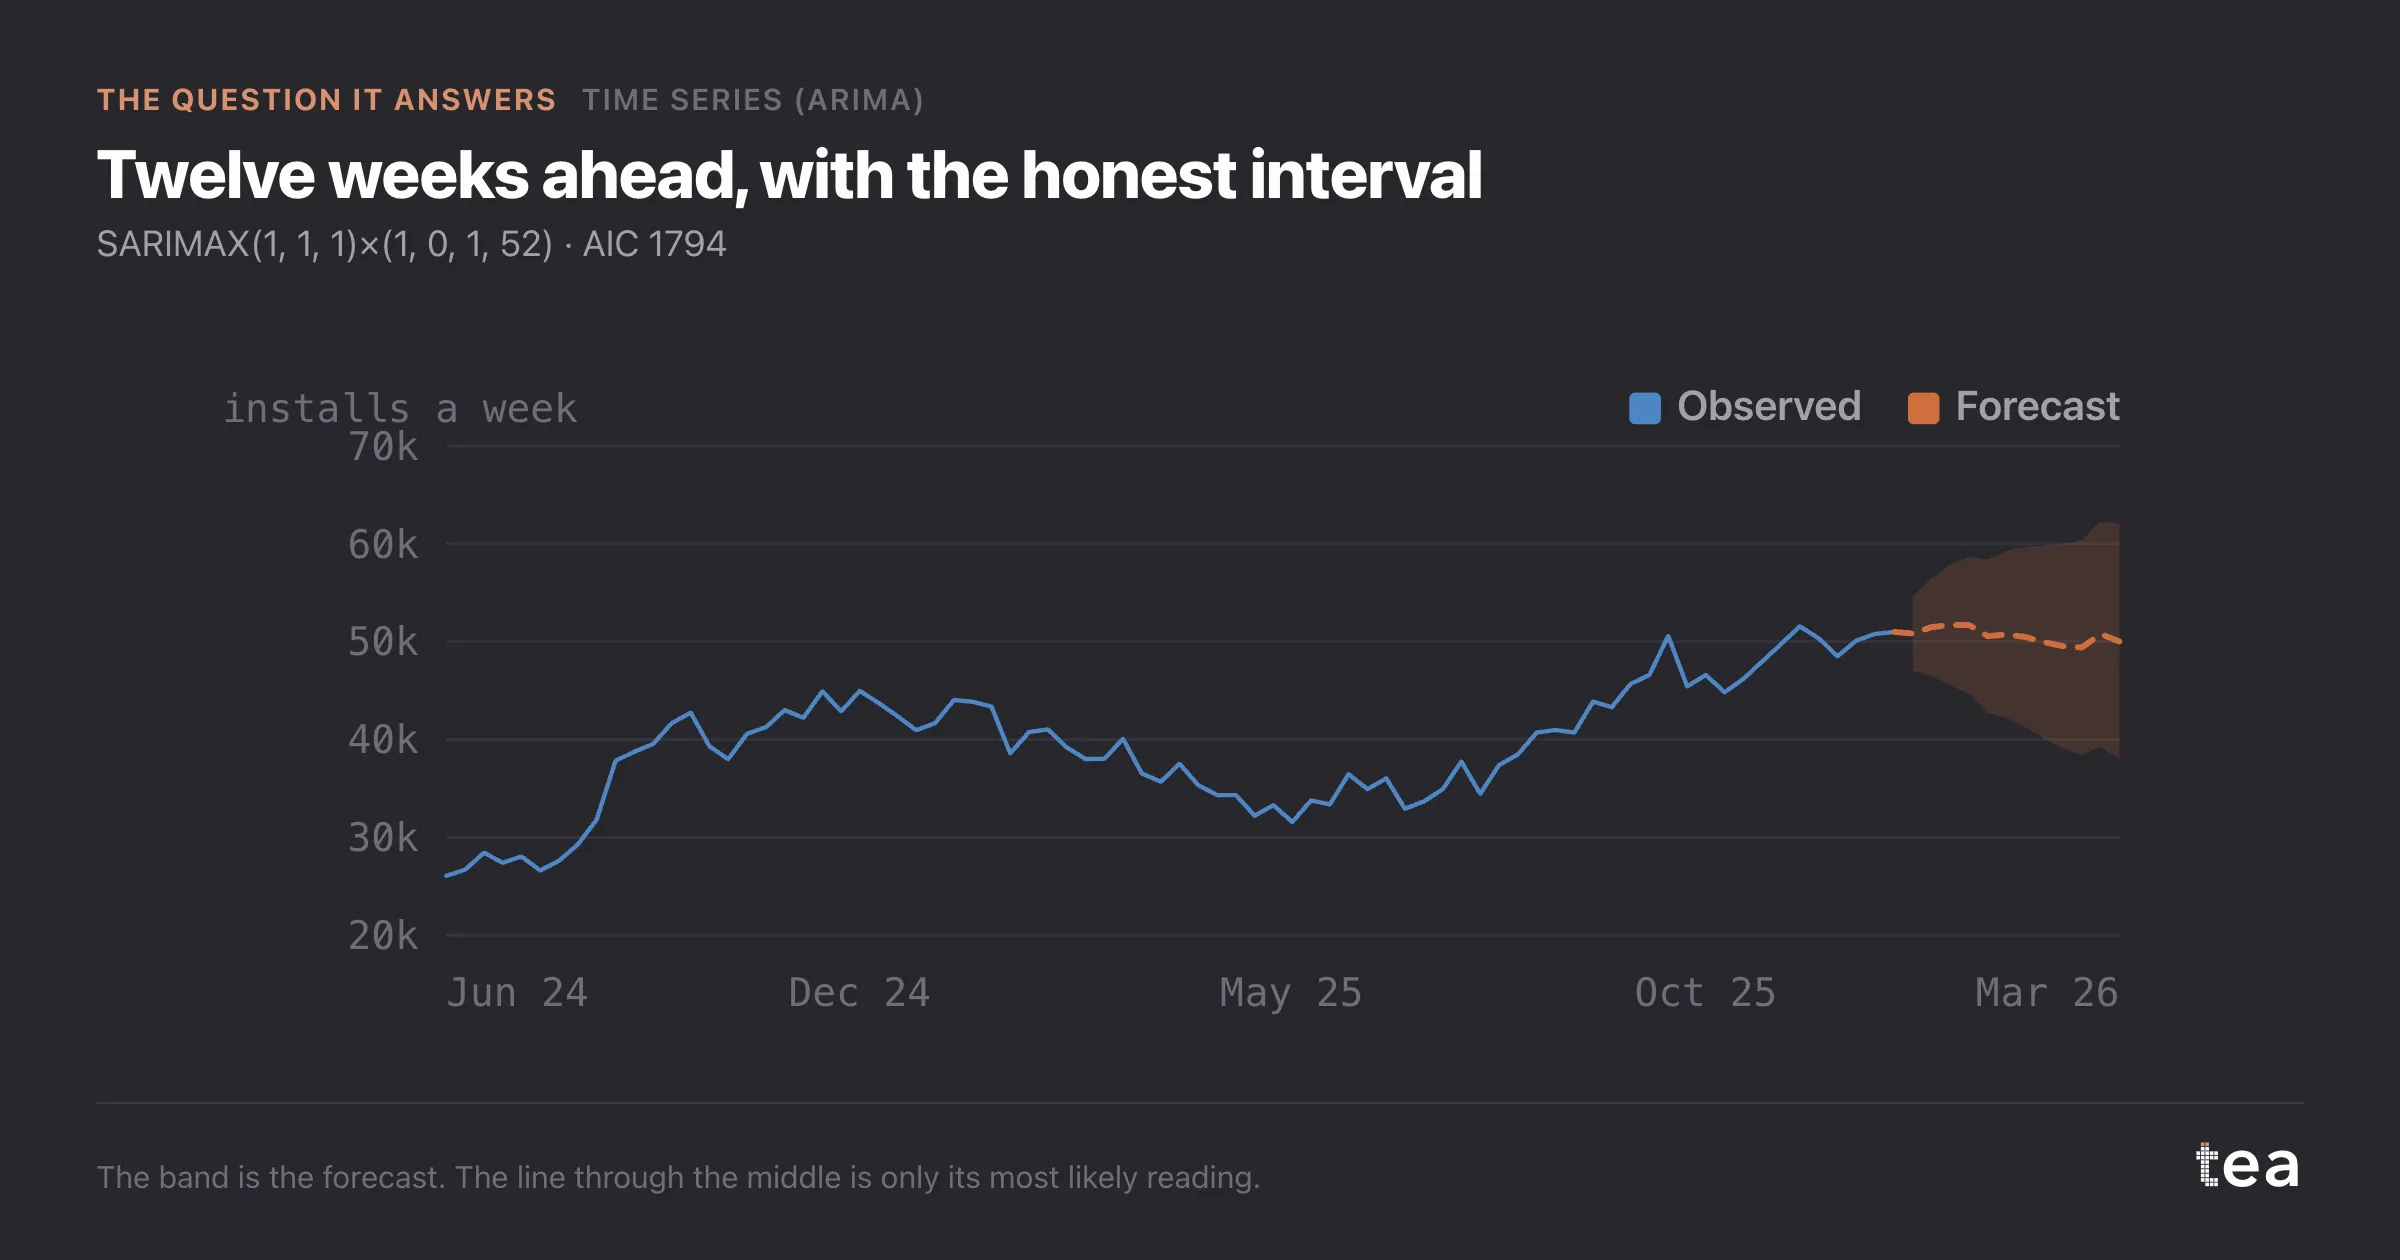
And when someone asks for the number, give them the number and the width in the same sentence. "About 50,000 a week, and by December the honest range is 38,000 to 62,000" is a sentence a business can act on. "50,000" is a sentence that will be quoted back at you in January.
There is a cultural point underneath the arithmetic. Precision is cheap to fake and expensive to have. The model that admits its limits is the one you can keep using, because it has not spent its credibility on a number it could not hold.
One more use for this curve that has nothing to do with forecasting. It is a good way to decide how much history to buy. If the band is already wide at week four, more sophisticated modelling will not fix it: the series is genuinely volatile, and the answer is either more data, a longer period, or a decision that tolerates the range.
And if the band is narrow all the way out, be suspicious rather than pleased. A twelve-week interval that barely widens usually means the model has understated the uncertainty, and that is the failure mode nobody notices until the quarter closes.
The chart is the actual output of Time Series (ARIMA) in TEA, and the interval comes from the same fit as the forecast.
tea, the product
Your file, this question
Fifteen analyses on a CSV of weekly data, with the intervals and the diagnostics shown, and a plain sentence when the data cannot answer. Free while in beta, by invitation.
Request a place in the beta→tea, the product
Fifteen econometric analyses on your own CSV: Time Series (ARIMA), saturation curves, elasticities, budget allocation. Intervals and diagnostics shown, and a plain sentence when the file cannot answer.
Free while in beta, by invitation.
Request a place in the beta →Liked this? Run it on your own data.
tea runs Time Series (ARIMA) and fourteen other analyses on any weekly CSV, in minutes. Free while in beta, by invitation.