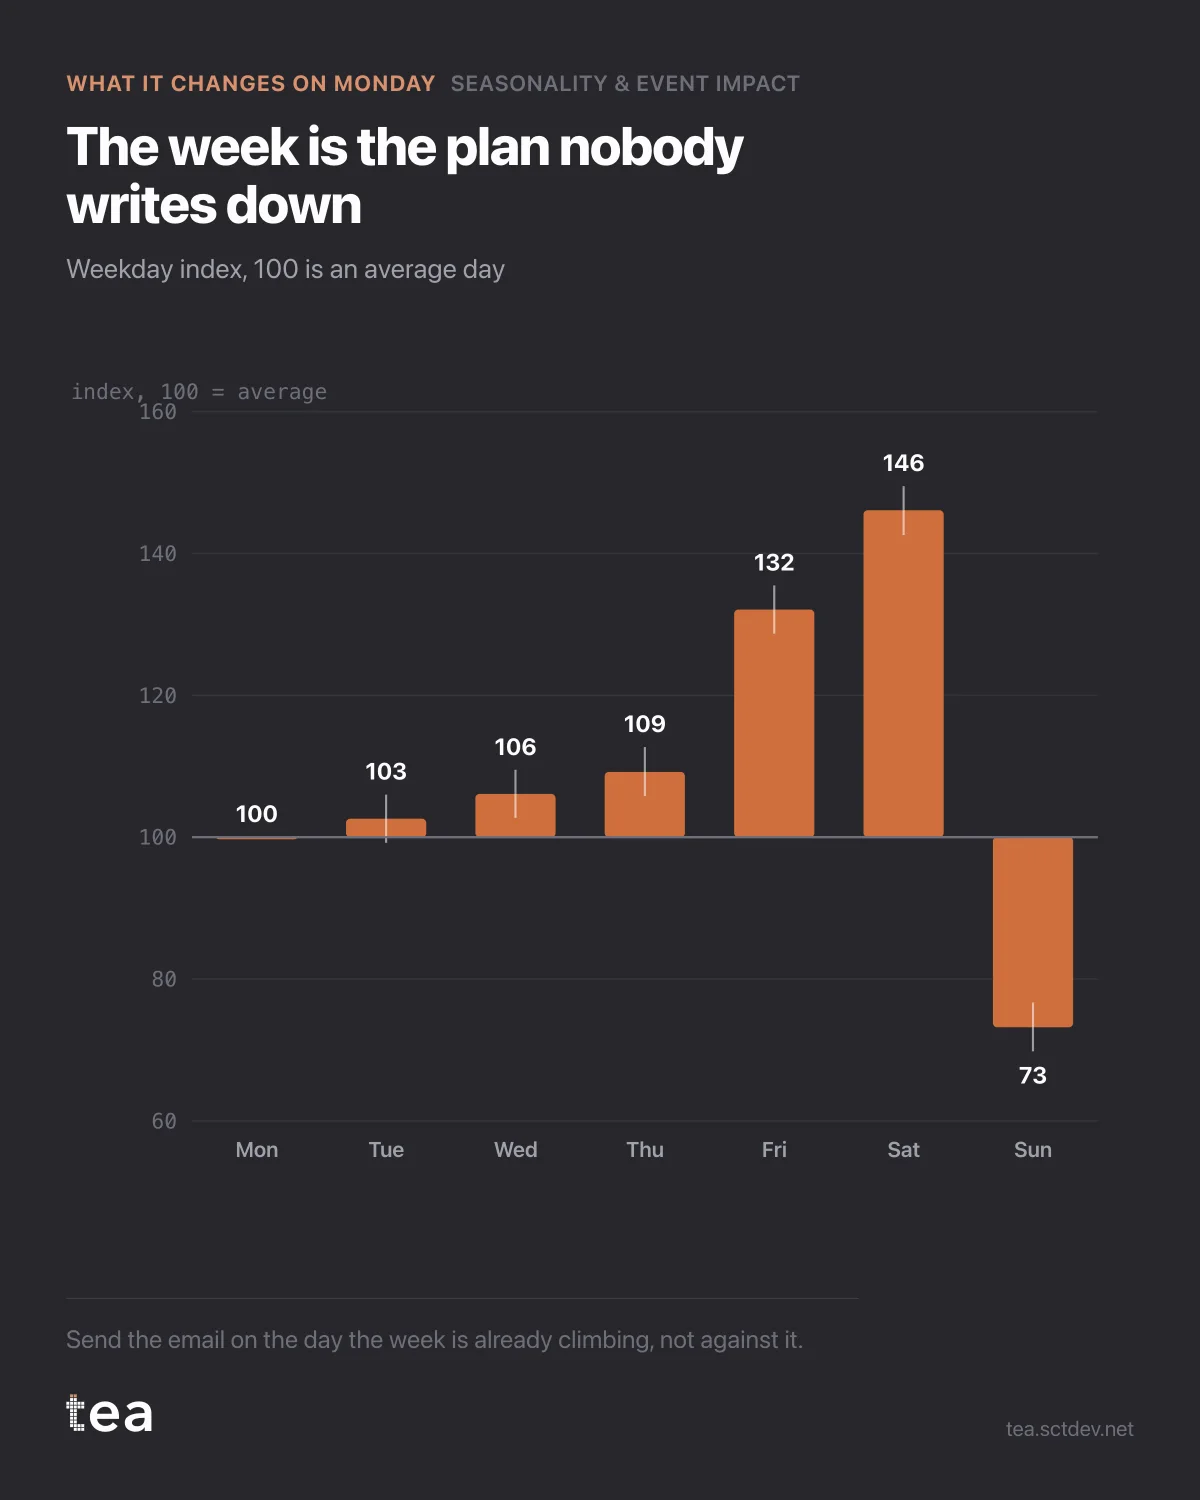
Saturday is 146. Sunday is the worst day of the week. This is a retail series, and the index is set so that 100 is an average day.
Seven bars, and most media calendars are built as if all seven were the same.
Here is what the week is worth, concretely. If Saturday runs 46% above average and Sunday runs below it, then an email sent on the wrong day is not a small loss of efficiency: it is competing with the structural shape of demand rather than riding it. Same creative, same list, same budget, different day, materially different result, and the reporting will credit the creative.
Three decisions this chart settles.
When to send, post and go live. Not by convention, not by what the calendar tool defaults to, but by where the week is already climbing. The cheapest uplift in marketing is timing, because it costs nothing and nobody has to approve a budget for it.
How to read a test. An A/B test that runs Tuesday to Thursday for A and Friday to Sunday for B has measured the weekday profile, and it will do it with enough precision to look convincing. Weekday effects of this size are large enough to swamp a genuine creative difference, which is how teams end up rolling out the losing variant with confidence.
Where to put the promotion. A discount on the day demand is already peaking buys volume you were getting anyway. The same discount on a structurally weak day buys incremental volume. Both show uplift against the previous day. Only one of them is worth the margin.
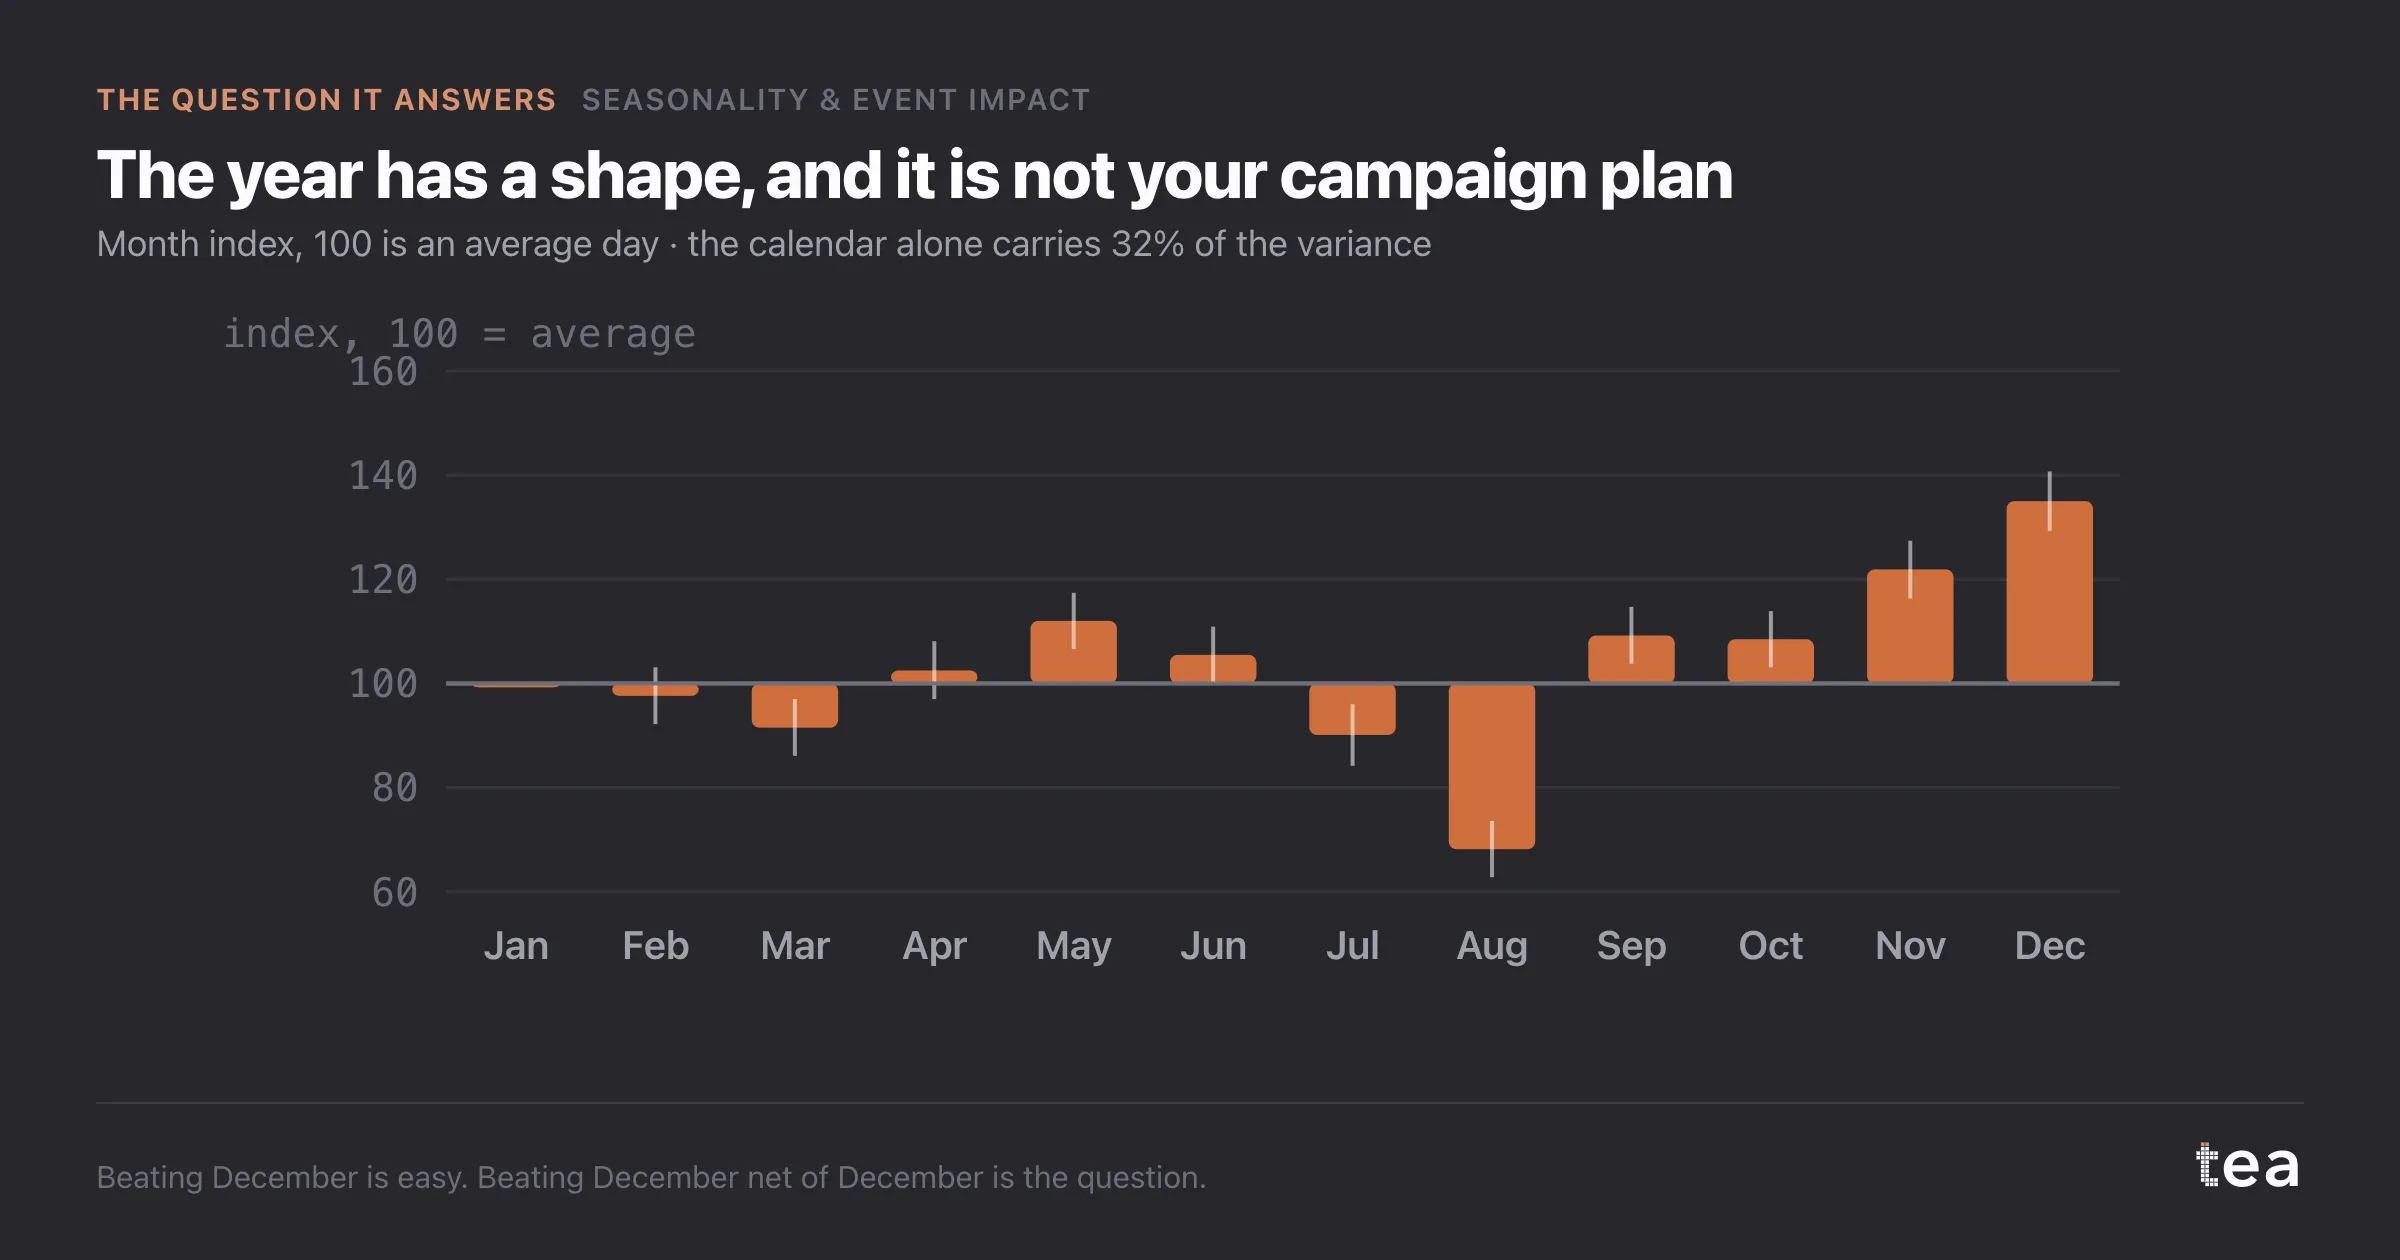
The bigger point is that a business has a rhythm nobody wrote down. The week has a shape, the month has a shape, and both are stable enough to plan against. Most organisations discover their own rhythm by accident, one campaign at a time, and rediscover it every time the team changes.
Seven bars from three years of history. It is the cheapest planning asset on this list and it stays true for years.
One caveat, and it is the same one every time. These are averages over three years. A weekday profile shifts when the business changes: a new delivery window, a new opening hour, a channel mix that moves online. Refit it once a year, and treat a sudden change in the shape as news about the business rather than as noise.
The last thing to say is about ownership. Nobody is responsible for the weekday profile, which is exactly why it never gets used. It sits between media, CRM and trade, and each of them assumes somebody else has already accounted for it. Put it in front of all three and the plan improves before anyone spends a euro.
The chart is the actual output of Seasonality & Event Impact in TEA, run on a sample file anyone can download.
tea, the product
Your file, this question
Fifteen analyses on a CSV of weekly data, with the intervals and the diagnostics shown, and a plain sentence when the data cannot answer. Free while in beta, by invitation.
Request a place in the beta→tea, the product
Fifteen econometric analyses on your own CSV: Seasonality & Event Impact, saturation curves, elasticities, budget allocation. Intervals and diagnostics shown, and a plain sentence when the file cannot answer.
Free while in beta, by invitation.
Request a place in the beta →Liked this? Run it on your own data.
tea runs Seasonality & Event Impact and fourteen other analyses on any weekly CSV, in minutes. Free while in beta, by invitation.