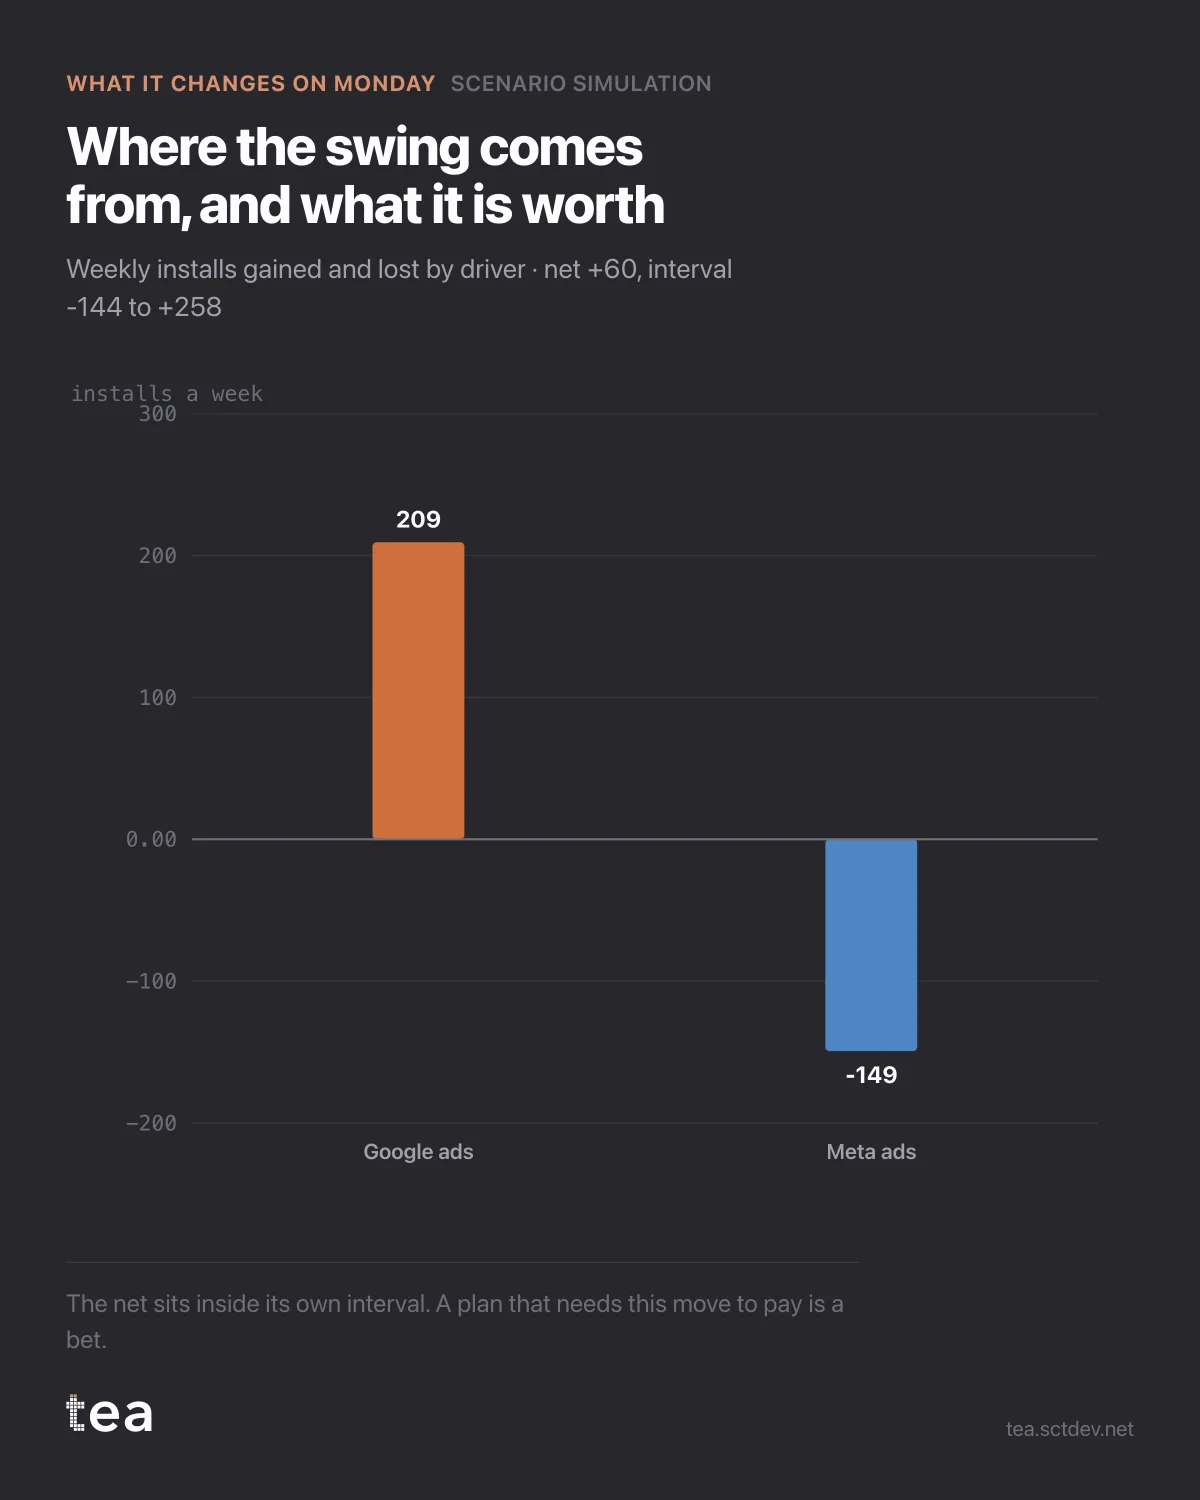
Two bars. Google ads up 25% gains 209 installs a week. Meta ads down 25% loses 149. Net, +60.
That is the whole scenario, and stated that way it sounds like an easy yes.
Here is the sentence that has to go next to it: the net sits inside its own confidence interval, which runs from -144 to +258.
In other words, the most likely outcome of this reallocation is a small gain, and the data cannot rule out a small loss. The plan is not wrong. It is unproven, and those are different things that get treated identically in most decks.
What to do with a result like this, because "do nothing" is rarely the right answer either.
Take the move if it is cheap to take and cheap to reverse. A 25% shift between two digital channels is both. The expected value is slightly positive, the downside is bounded, and you will learn something about the curves from the next quarter of data.
Do not build a target on it. Nothing that needs +60 installs a week to be true should be in a plan where +60 might be -144.
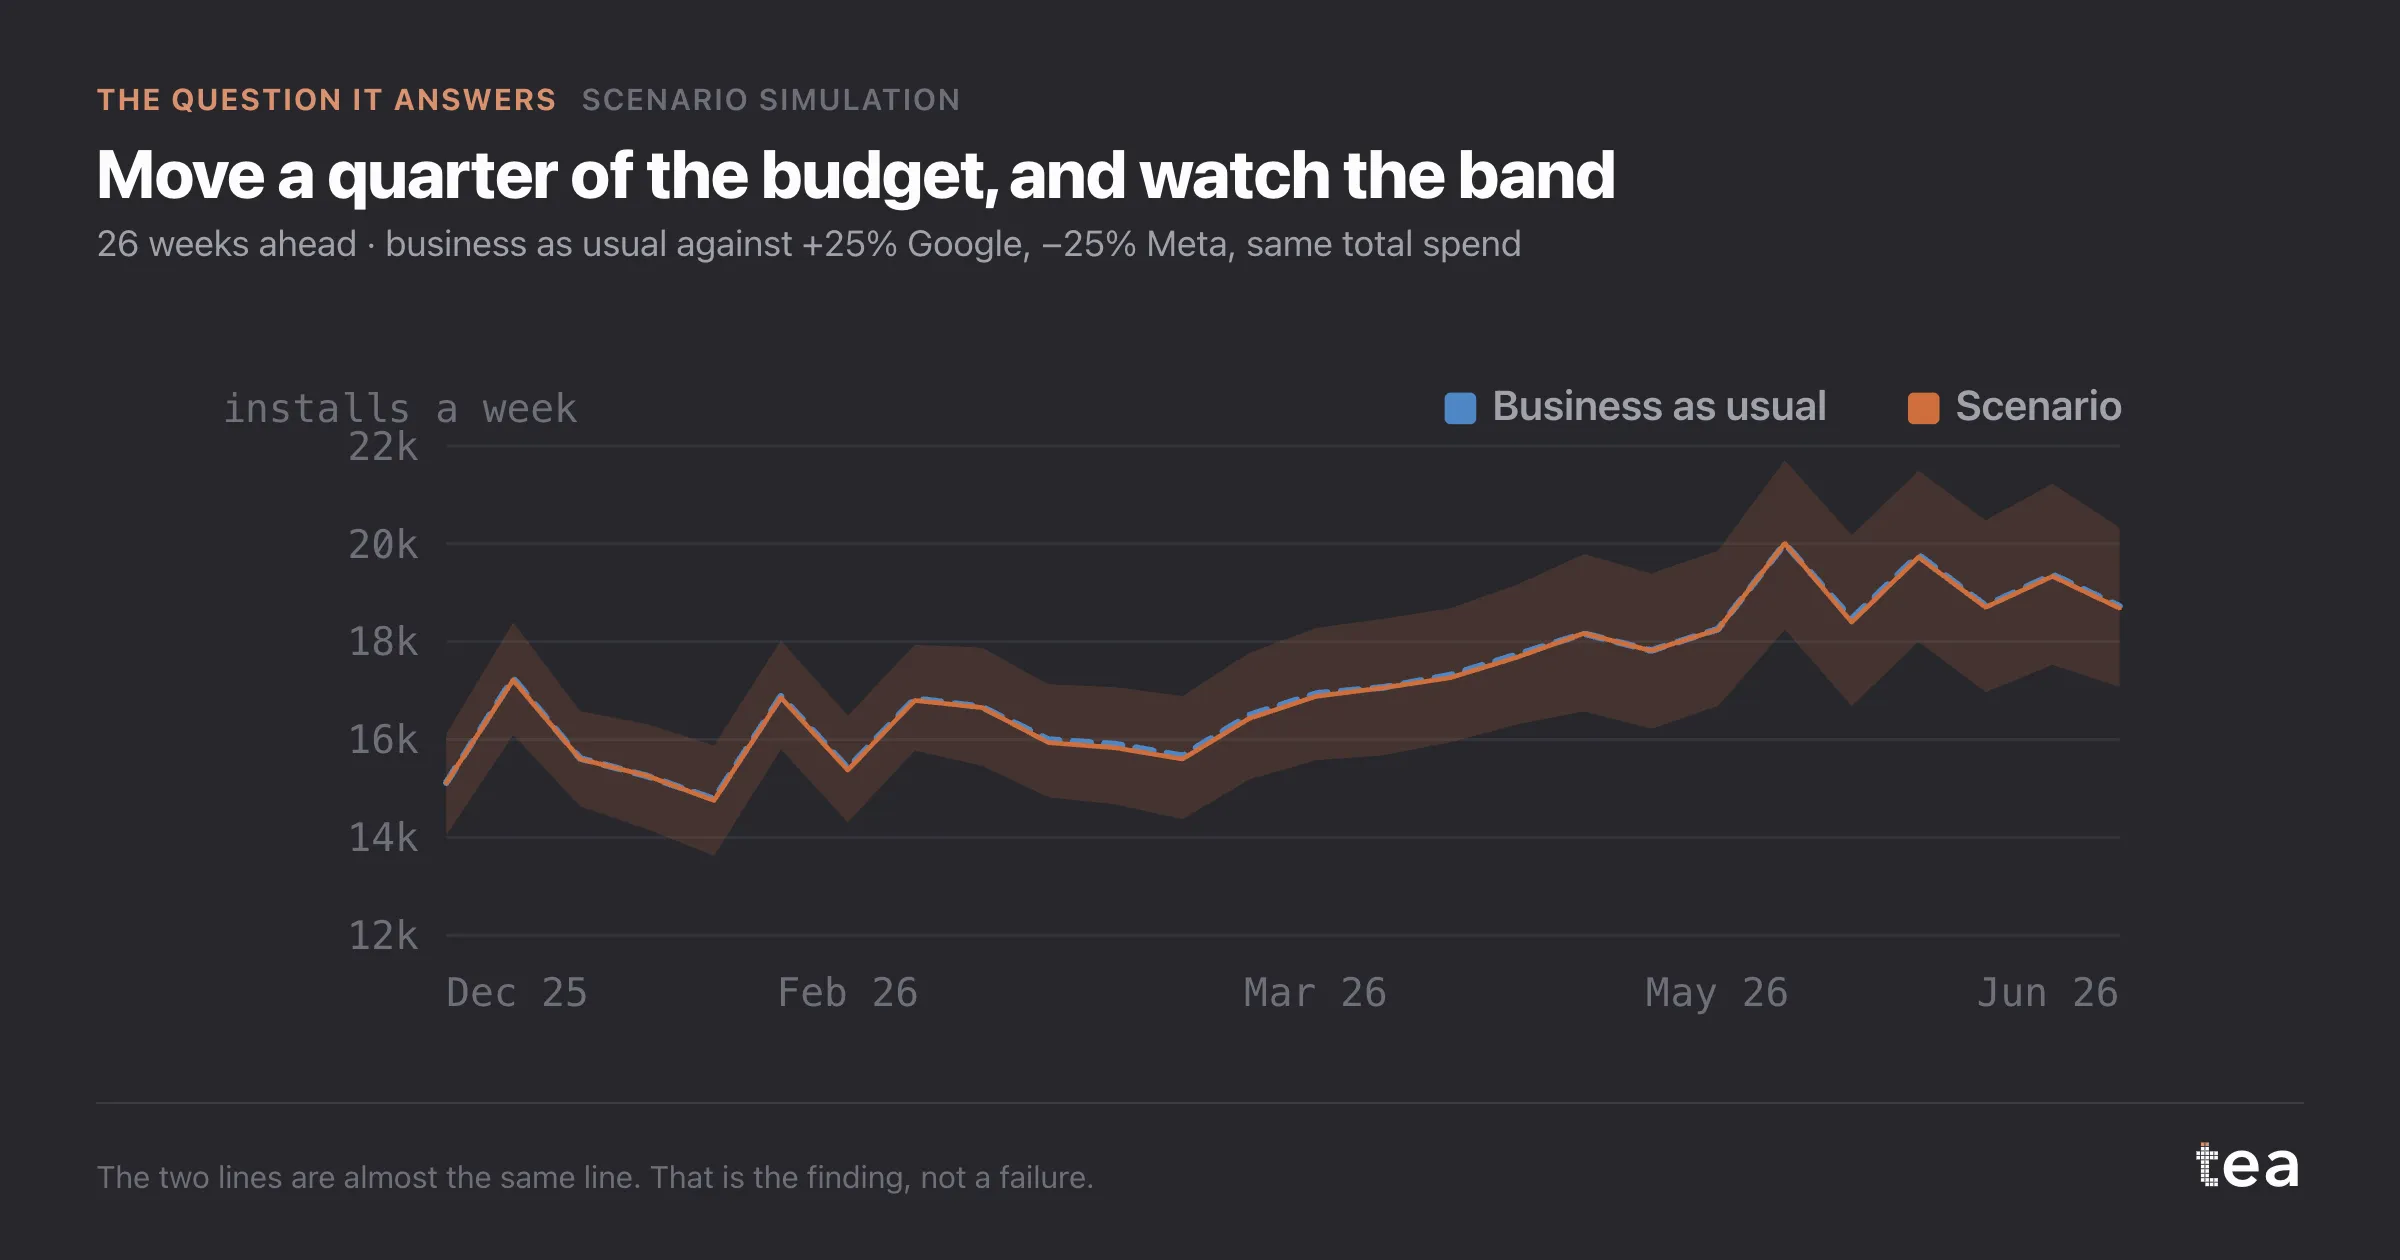
And treat the result as an instruction about measurement rather than about media. A model that cannot distinguish two of its own channels is telling you their spend patterns are too similar to separate. Flight them differently for a quarter and the next fit will have something to read.
The deeper habit is this. A scenario tool that always returns a confident number is not a tool, it is a slot machine with good typography. The value of simulation is precisely in the cases where it says the difference is inside the noise, because those are the cases where a confident plan would have cost real money for no expected return.
The most useful output of a model is often a shrug with a number attached.
A last point about how this gets presented, since presentation decides what happens to it. Put the interval in the same sentence as the point estimate, always, and in the same font size. Every convention in business reporting pushes the other way: the number goes in the headline and the uncertainty goes in a footnote nobody reads.
The teams that get good at this end up with a shared vocabulary for it. Moves that are worth taking and cheap to reverse. Moves that are worth testing before scaling. Moves the data cannot support at all. Three categories, and a scenario chart with a band is what sorts a proposal into one of them.
The chart is the actual output of Scenario Simulation in TEA, run on a sample file anyone can download.
tea, the product
Your file, this question
Fifteen analyses on a CSV of weekly data, with the intervals and the diagnostics shown, and a plain sentence when the data cannot answer. Free while in beta, by invitation.
Request a place in the beta→tea, the product
Fifteen econometric analyses on your own CSV: Scenario Simulation, saturation curves, elasticities, budget allocation. Intervals and diagnostics shown, and a plain sentence when the file cannot answer.
Free while in beta, by invitation.
Request a place in the beta →Liked this? Run it on your own data.
tea runs Scenario Simulation and fourteen other analyses on any weekly CSV, in minutes. Free while in beta, by invitation.