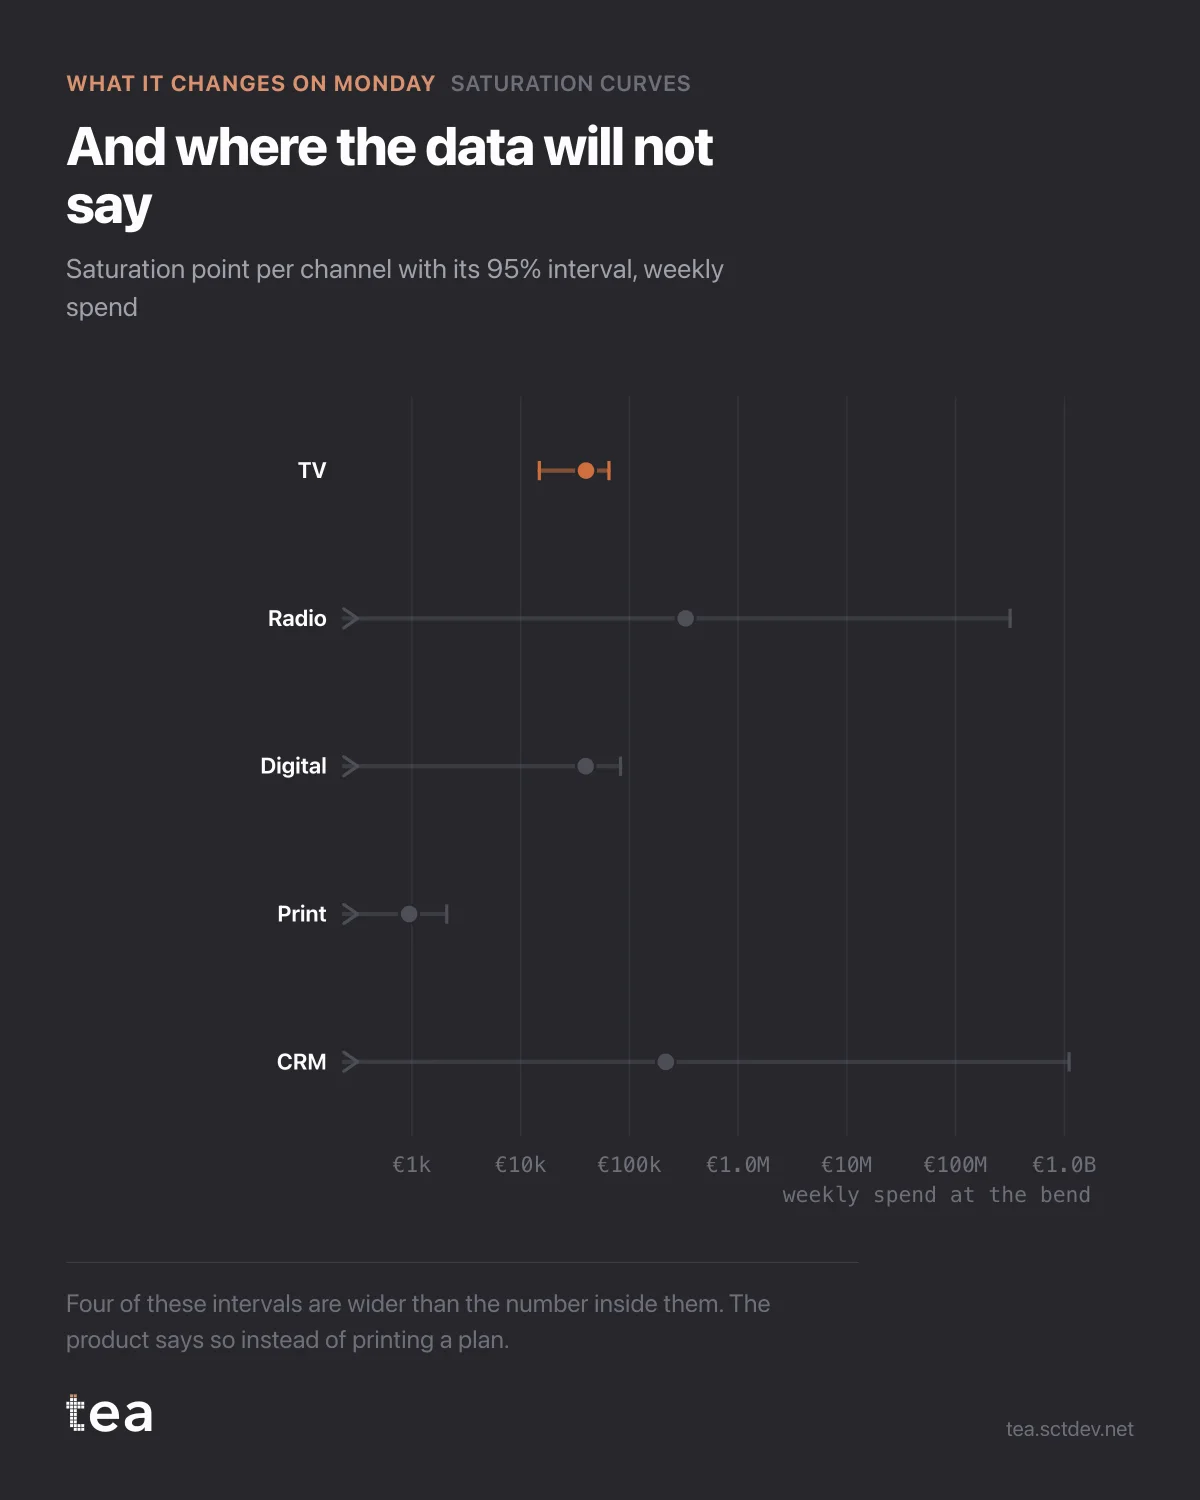
Five channels, five fitted saturation points, and four of them are useless. That is the finding, and the chart is built so you can see it rather than be told it.
Each row is a channel with its bend and the 95% interval around it, on a log axis because the numbers span four orders of magnitude.
TV is the tight one. The other four run off the left edge of the chart, which is what an interval reaching zero looks like when it is drawn honestly.
Radio's bend is fitted at €329,386 a week against an actual spend of €9,549. Print's at €944 against a spend of €4,192. Taken literally, those numbers say radio is enormously underfunded and print is thirty times past saturation. Taken with their intervals, they say nothing at all.
This is the part of the workflow that vendors usually skip. A fitting routine always returns a number. Whether that number carries information is a separate question, answered by the interval and the fit quality, and it is the question that decides whether a budget should move.
So the decision rule is not "act on the point estimate". It is:
If the interval is tight and your spend is clearly on one side of the bend, act. That is a real finding, and it is usually worth money immediately.
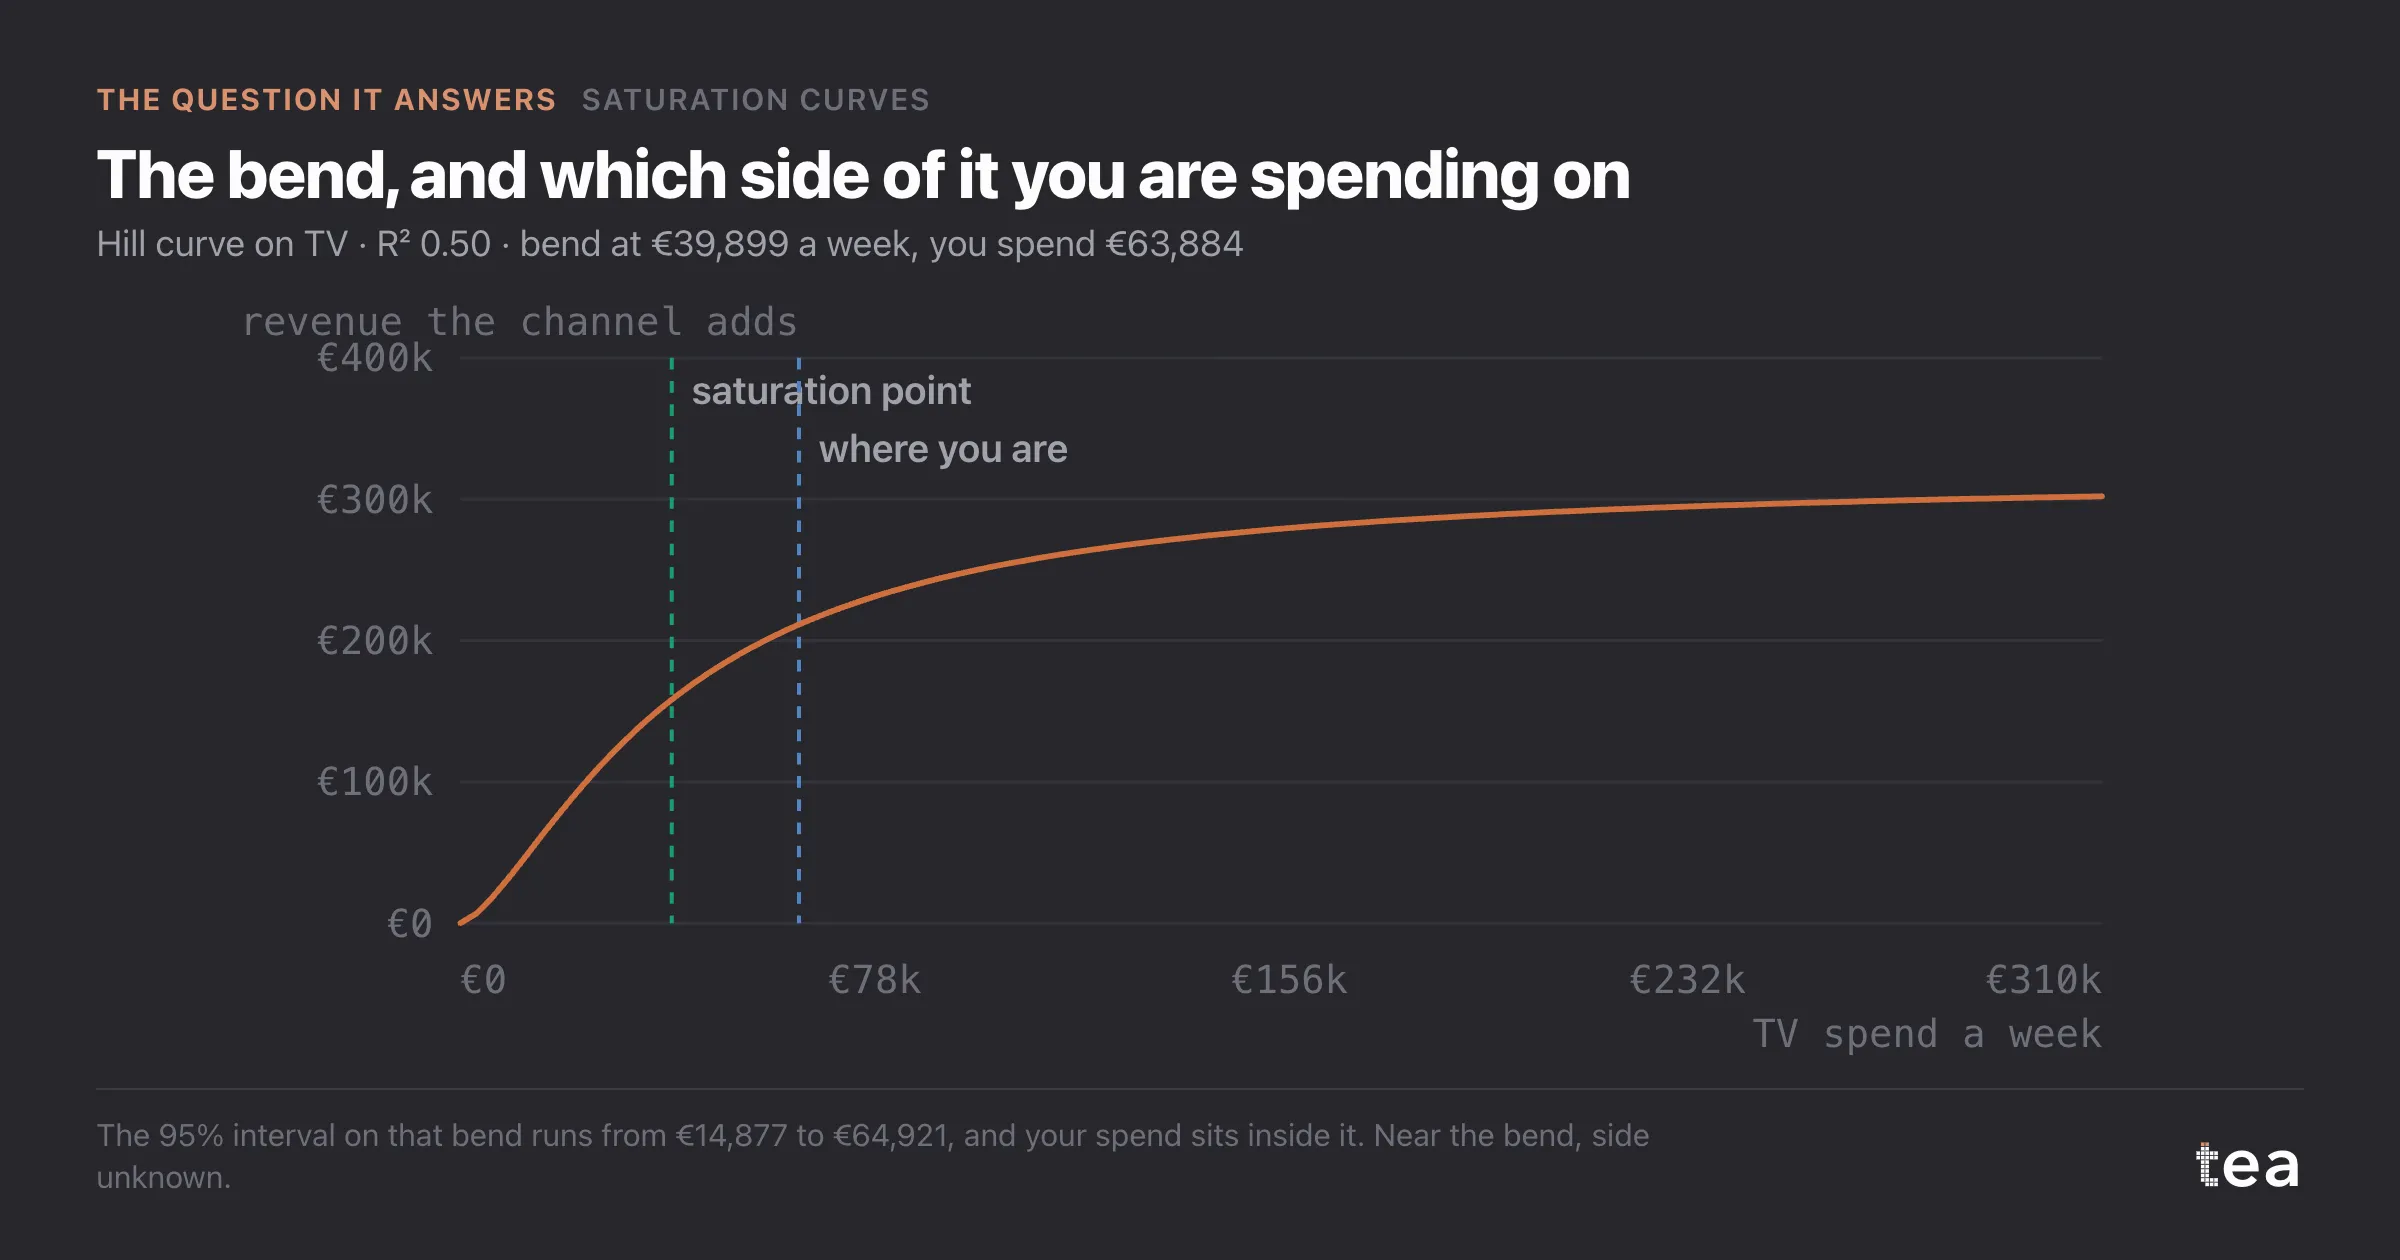
If the interval contains your current spend, hold. You are near the bend and the data cannot say which side. Gather more periods, or fit the channels jointly so they stop absorbing each other's variance.
If the interval spans decades, stop reading that row. The channel is too small, too correlated with something else, or too constant to identify on its own.
Four of these five rows are in that last category, and the product prints the sentence rather than quietly rounding it into a plan. "This data will not say" is an answer. It is usually a cheaper answer than a plan built on a coin toss, and it points at exactly what to run next.
There is a second reading of this chart that is about data rather than media. Four weak rows out of five is a diagnosis of the file, not of the channels. It says the spend patterns are too similar, or the period is too short, or the small channels are lost inside weekly revenue noise.
Knowing that before a planning cycle is worth more than a confident ranking, because it changes what you go and collect. That is the whole purpose of showing intervals instead of hiding them: the analysis that cannot answer tells you precisely what would let it.
The chart is the actual output of Saturation Curves in TEA, run on a sample file anyone can download.
tea, the product
Your file, this question
Fifteen analyses on a CSV of weekly data, with the intervals and the diagnostics shown, and a plain sentence when the data cannot answer. Free while in beta, by invitation.
Request a place in the beta→tea, the product
Fifteen econometric analyses on your own CSV: Saturation Curves, saturation curves, elasticities, budget allocation. Intervals and diagnostics shown, and a plain sentence when the file cannot answer.
Free while in beta, by invitation.
Request a place in the beta →Liked this? Run it on your own data.
tea runs Saturation Curves and fourteen other analyses on any weekly CSV, in minutes. Free while in beta, by invitation.