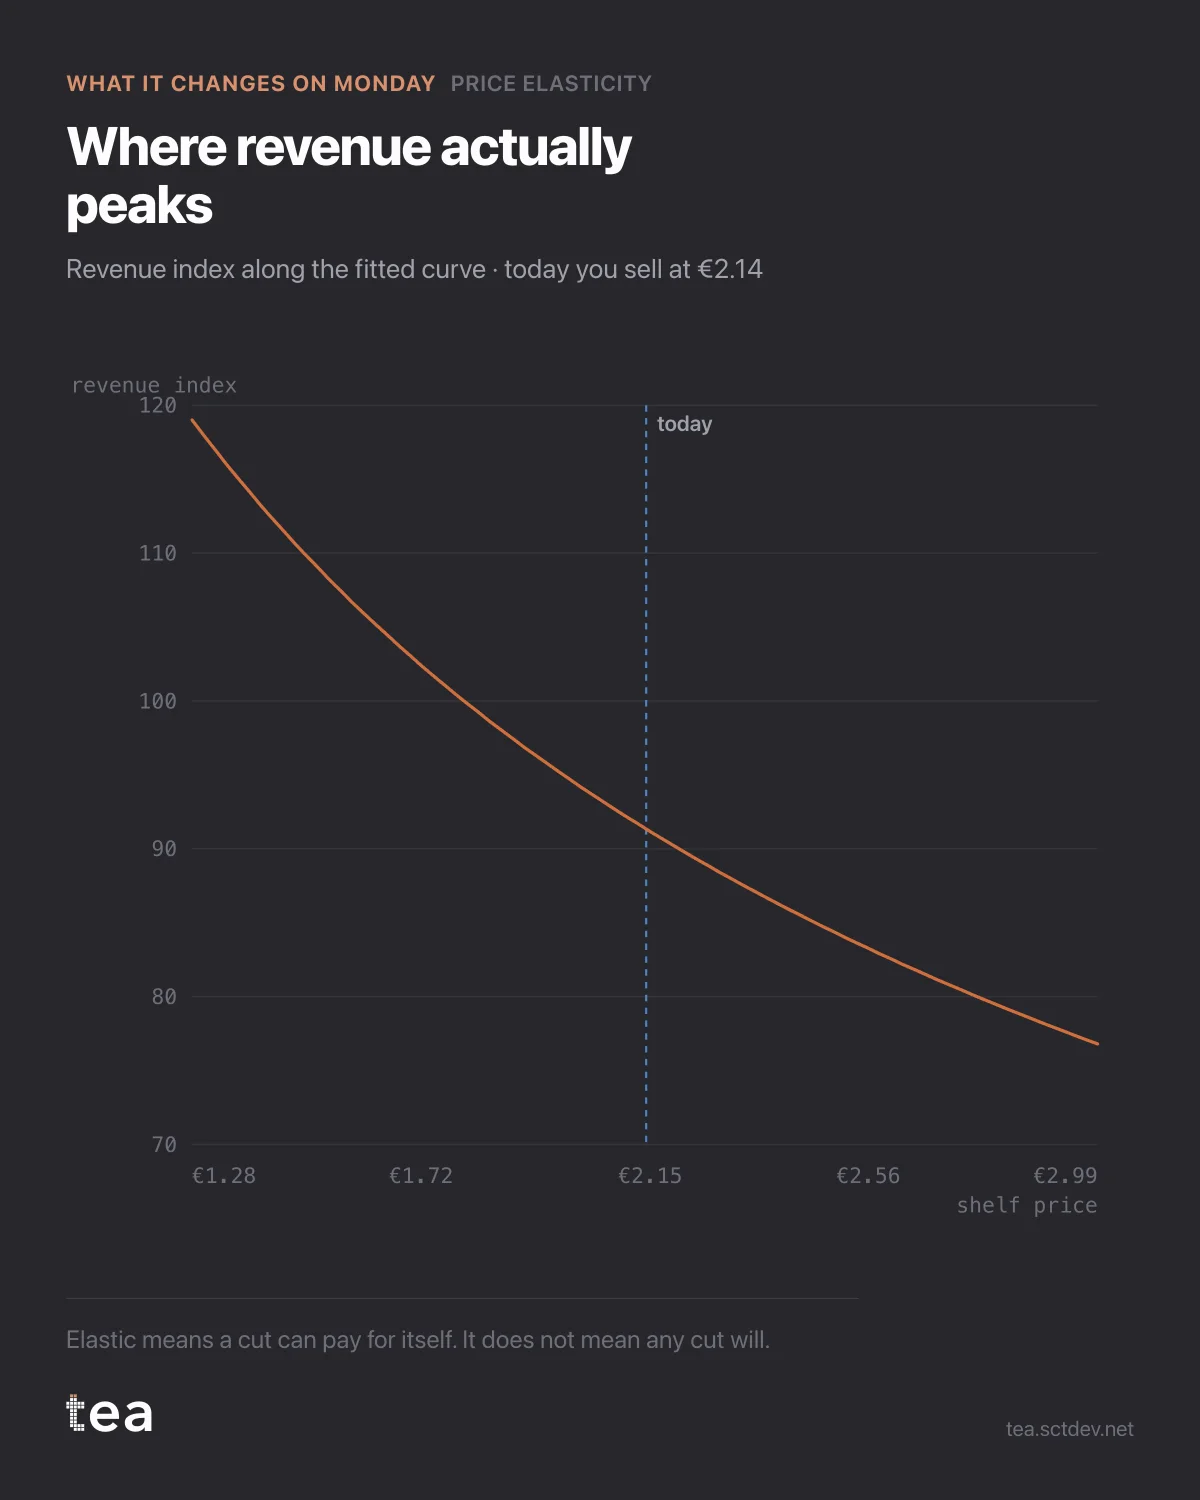
Elastic means a price cut can pay for itself. It does not mean every cut will, and this is the chart that separates the two.
The curve is the revenue index along the fitted demand relationship. The marker is where this business prices today, at €2.14.
Today sits at 91 on the index. A 10% cut moves it to 106. A 20% cut to 112. Thirty percent down, at €1.50, is the top of the observed range at 120, with volume up 72%.
Now the part a curve cannot decide for you.
This is revenue, not margin. At -30% the volume is 72% higher, which means 72% more units to buy, handle, ship and stock. If the gross margin is thin, a revenue maximising price can be a profit destroying one, and the same curve with margin on the vertical axis peaks in a different place.
It also assumes everything else holds. The competitor does not respond, the promotional calendar stays as it was, distribution does not change. On a category where the cross-elasticity is larger than the own-price effect, that assumption is doing a lot of work, and a matched response would move the whole curve rather than your position on it.
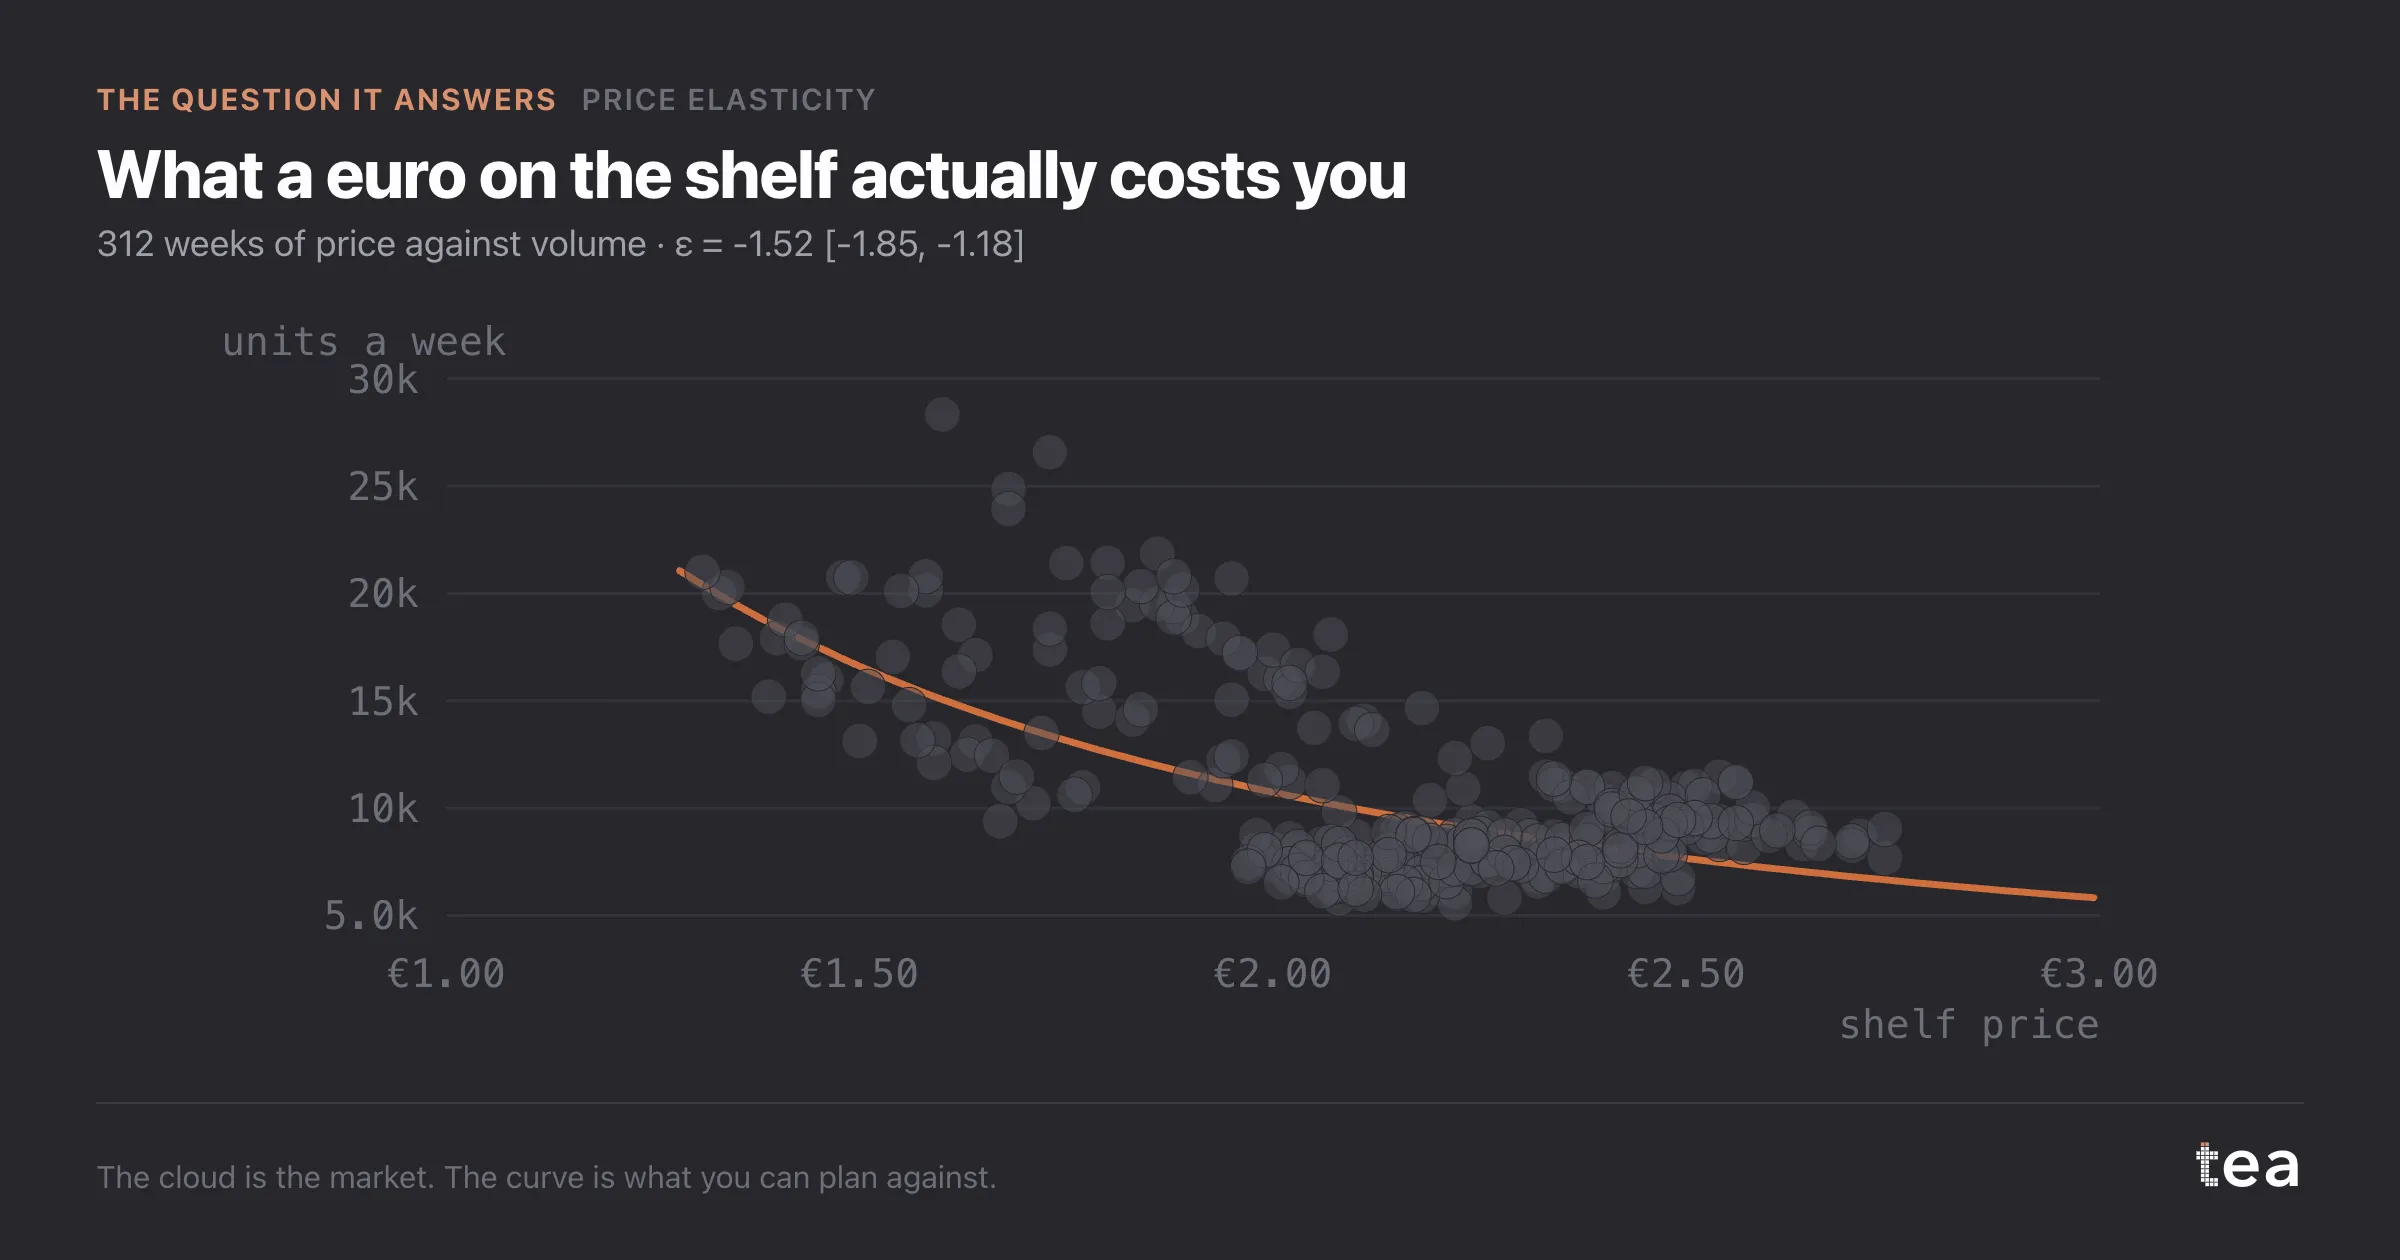
And the far end of the curve is the thin end of the evidence. Thirty percent down is at the edge of the prices this business has actually run, so the estimate there rests on the fewest observations and the most extrapolation.
So the practical reading is narrower than the chart. Today is not near the peak, and the direction of travel is clear enough to test. The move to test is the 10% step, in a controlled set of stores or a region, with the model refitted afterwards on the new range.
The value here is not that a model found a better price. It is that the trade has been made explicit: this much volume, at this much revenue, with this much confidence, at a price the business has seen before.
If you can only take one habit from this, take the refit. Every price move generates new observations at a price level you had not seen, which is exactly the variation the model was missing. A business that moves price and refits every quarter builds a demand curve it can trust. A business that runs one study a year keeps making decisions on the same increasingly old estimate.
And whichever way the decision goes, write down what the curve predicted before the price changes. The comparison afterwards is the cheapest validation available, and it is the one nobody does.
The chart is the actual output of Price Elasticity in TEA, run on a sample file anyone can download.
tea, the product
Your file, this question
Fifteen analyses on a CSV of weekly data, with the intervals and the diagnostics shown, and a plain sentence when the data cannot answer. Free while in beta, by invitation.
Request a place in the beta→tea, the product
Fifteen econometric analyses on your own CSV: Price Elasticity, saturation curves, elasticities, budget allocation. Intervals and diagnostics shown, and a plain sentence when the file cannot answer.
Free while in beta, by invitation.
Request a place in the beta →Liked this? Run it on your own data.
tea runs Price Elasticity and fourteen other analyses on any weekly CSV, in minutes. Free while in beta, by invitation.