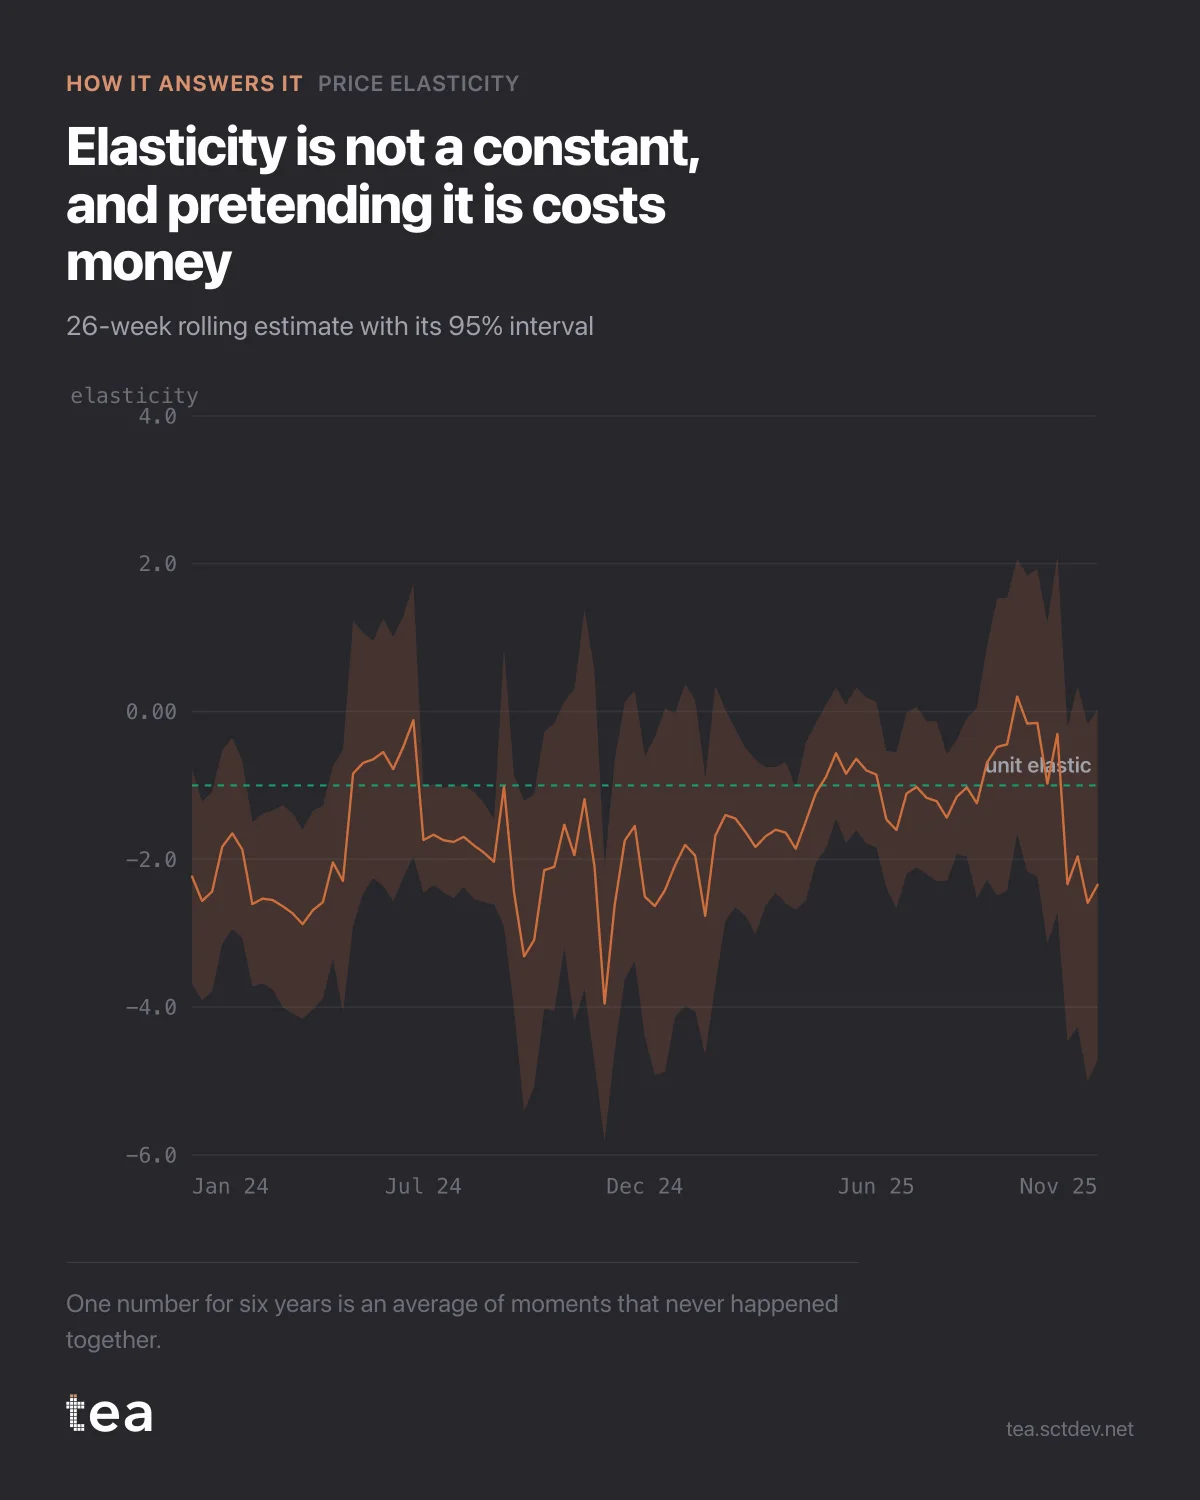
The headline was -1.52. This is the same elasticity estimated on a rolling 26 week window, and it moves between -3.95 and +0.20.
One number for six years is an average of moments that never happened together.
The band around the line is the 95% interval, and it does most of the work here. Where it is narrow, the estimate is real and the movement is signal. Where it opens up, the window has too little price variation to identify anything, and the line inside it is close to meaningless.
That distinction is what makes this chart worth more than the single figure. It tells you when your elasticity was measurable, which is not the same as when your price was moving.
Three reasons a rolling estimate drifts, all of them ordinary:
Competitive context. The cross-price effect in this file is 2.84, larger than the own-price effect. When a competitor changes strategy, your own elasticity changes with it, and nothing about your product has moved.
Promotional mix. A period heavy with deep promotions produces a different price response from a clean period, because the shoppers are different people.
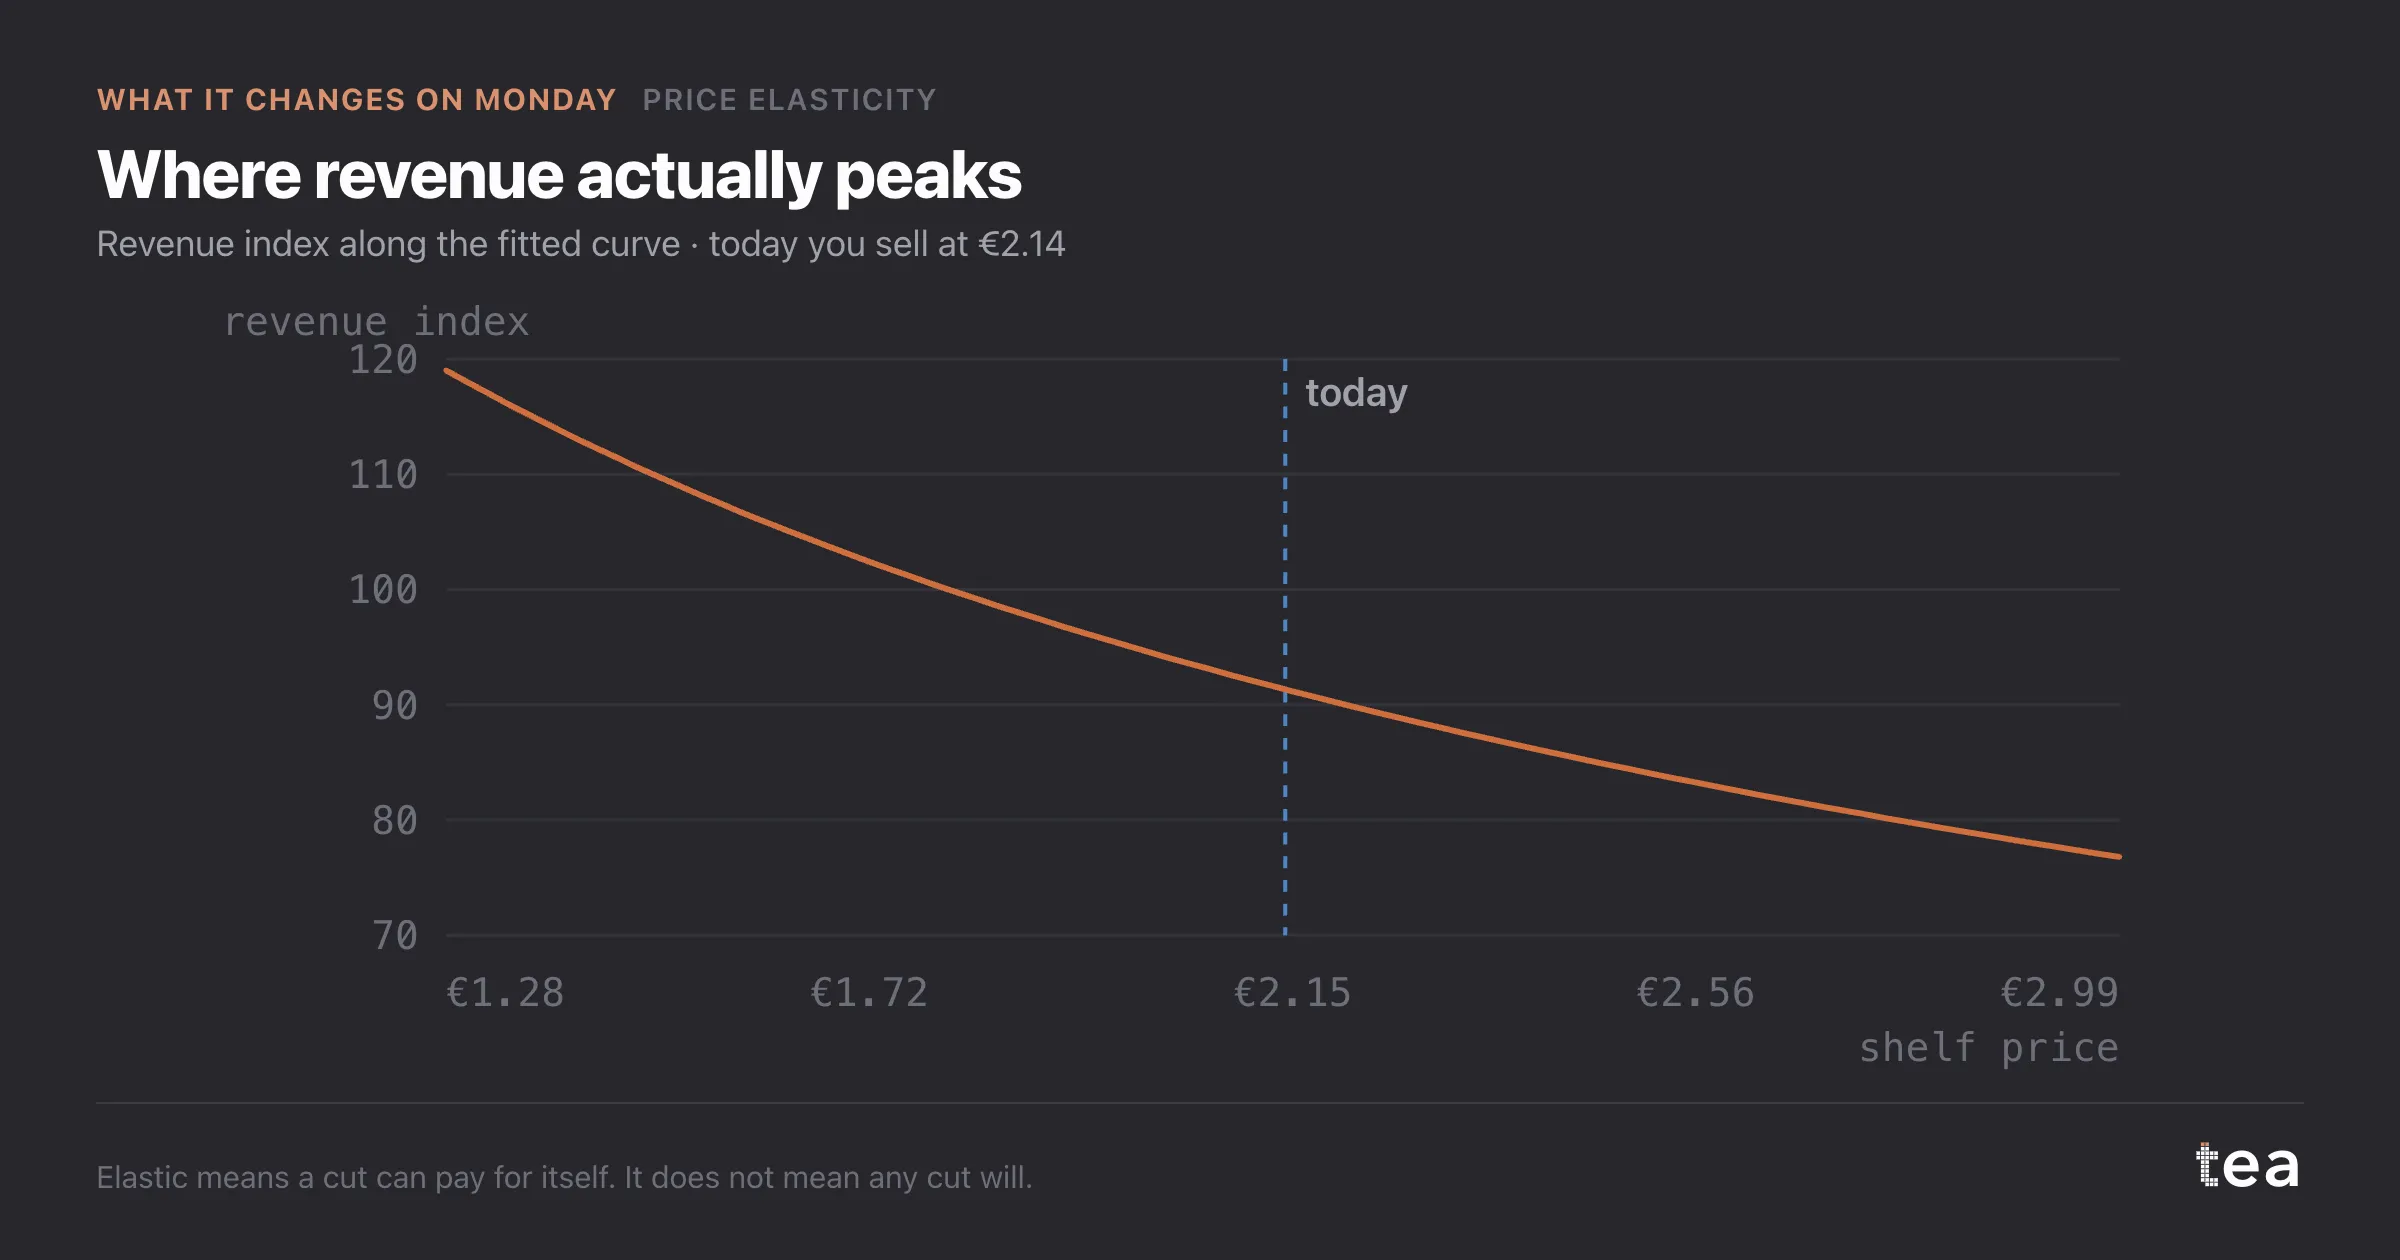
And category dynamics. Elasticity is a property of the market, not of the product. It shifts with inflation, with substitutes appearing, with distribution changing.
There is also a structural point in the regional splits. The same product comes back at -1.22 in one region, -1.59 in another and -2.23 in a third, each with its own interval. A single national elasticity is the average of three different businesses, and pricing on the average is wrong in every one of them.
What to do with it. Take the pooled number for direction. Take the rolling chart for confidence. Take the segment splits for execution. And refit before a major pricing decision rather than quoting a study from eighteen months ago, because the one thing this chart proves is that the number has a shelf life.
One warning about rolling windows generally. Twenty-six weeks is short enough to see change and long enough to estimate something, and both halves of that sentence matter. Shorten it to twelve and the line will move dramatically, mostly because the intervals have widened, and it is easy to mistake that noise for a story about the market.
If you present this chart, present it with the band. Without it, a rolling elasticity is an invitation to narrate every wobble, and someone will.
The chart is the actual output of Price Elasticity in TEA.
tea, the product
Your file, this question
Fifteen analyses on a CSV of weekly data, with the intervals and the diagnostics shown, and a plain sentence when the data cannot answer. Free while in beta, by invitation.
Request a place in the beta→tea, the product
Fifteen econometric analyses on your own CSV: Price Elasticity, saturation curves, elasticities, budget allocation. Intervals and diagnostics shown, and a plain sentence when the file cannot answer.
Free while in beta, by invitation.
Request a place in the beta →Liked this? Run it on your own data.
tea runs Price Elasticity and fourteen other analyses on any weekly CSV, in minutes. Free while in beta, by invitation.