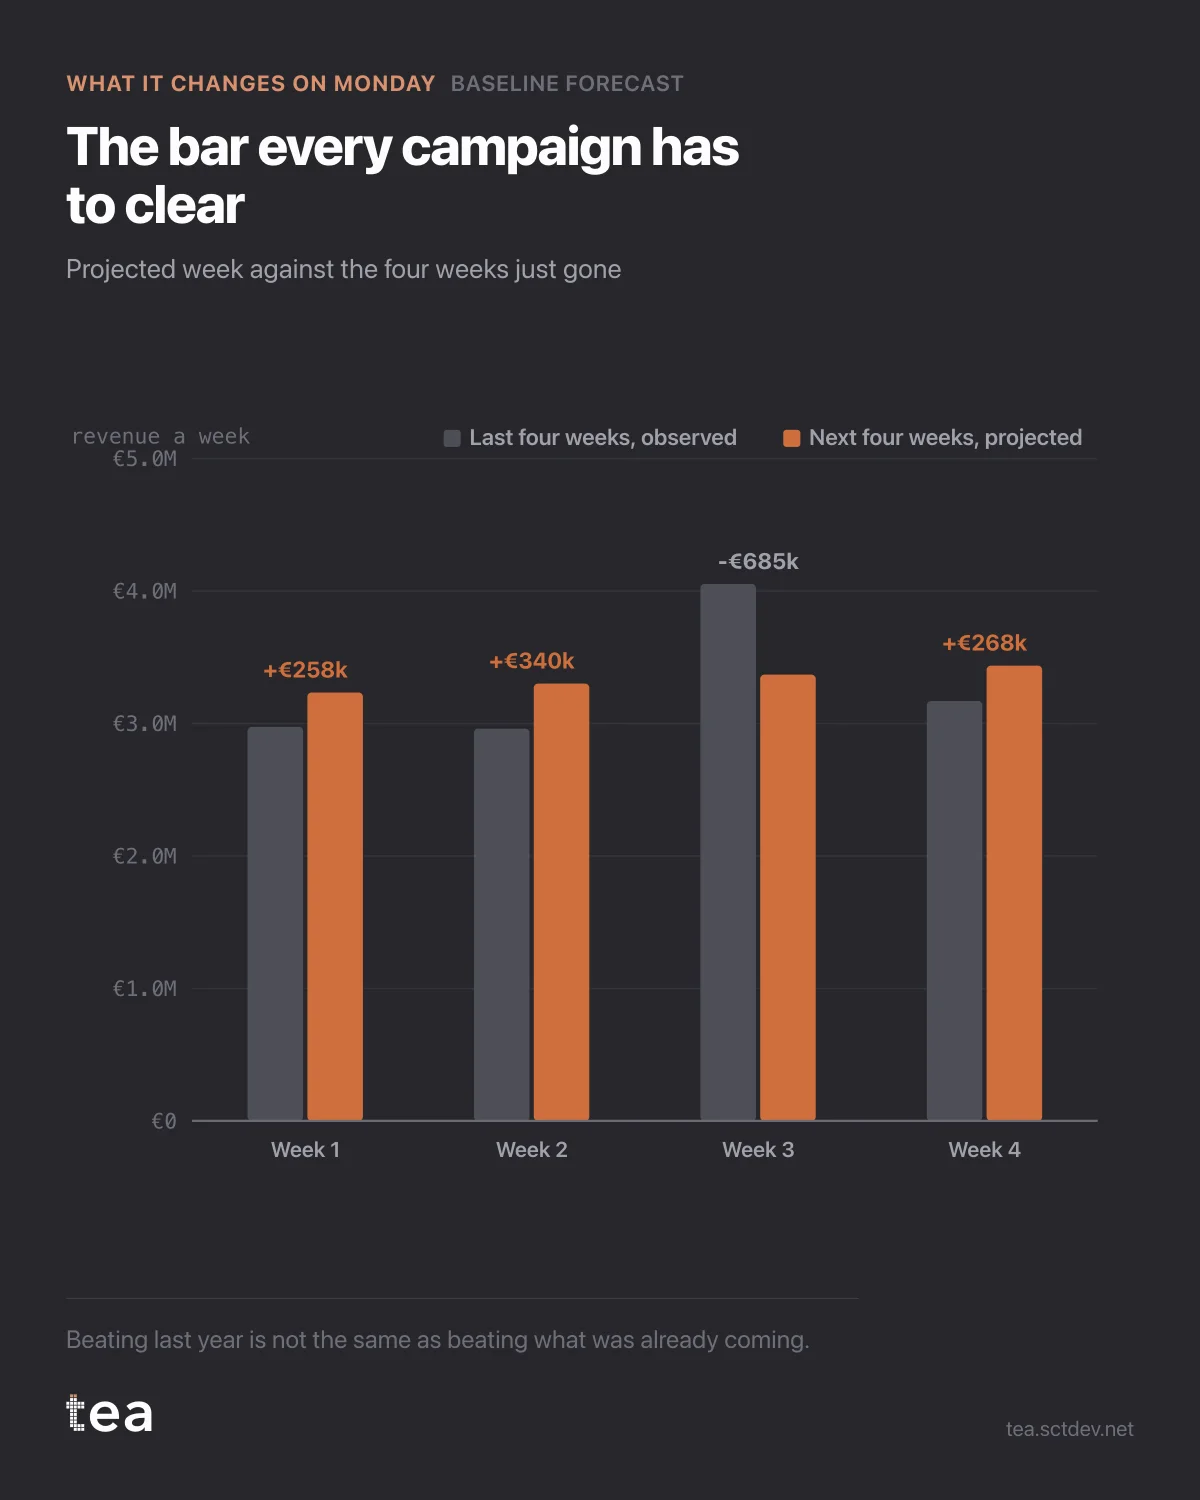
Here is the chart to put in front of a campaign brief, and it takes four bars.
Grey is what the last four weeks actually delivered. Terracotta is what the next four weeks are projected to deliver with nobody doing anything.
The total moves from 13.16M to 13.34M. A rise of 1.4%, already in the post, before a single euro of media is committed.
Now read a plan against it.
A campaign that promises plus 2% is promising six tenths of a point of its own work. That may still be the right campaign, at the right cost, but the number in the brief is not the number it will deliver.
A campaign that promises plus 10% is promising 8.6 points of genuine lift, which is a very large claim for four weeks in a grocery business, and it deserves the question of how.
And a flat month is not a failure if the baseline was pointing down. The bars tell you which of those worlds you are in before the money moves, not after.
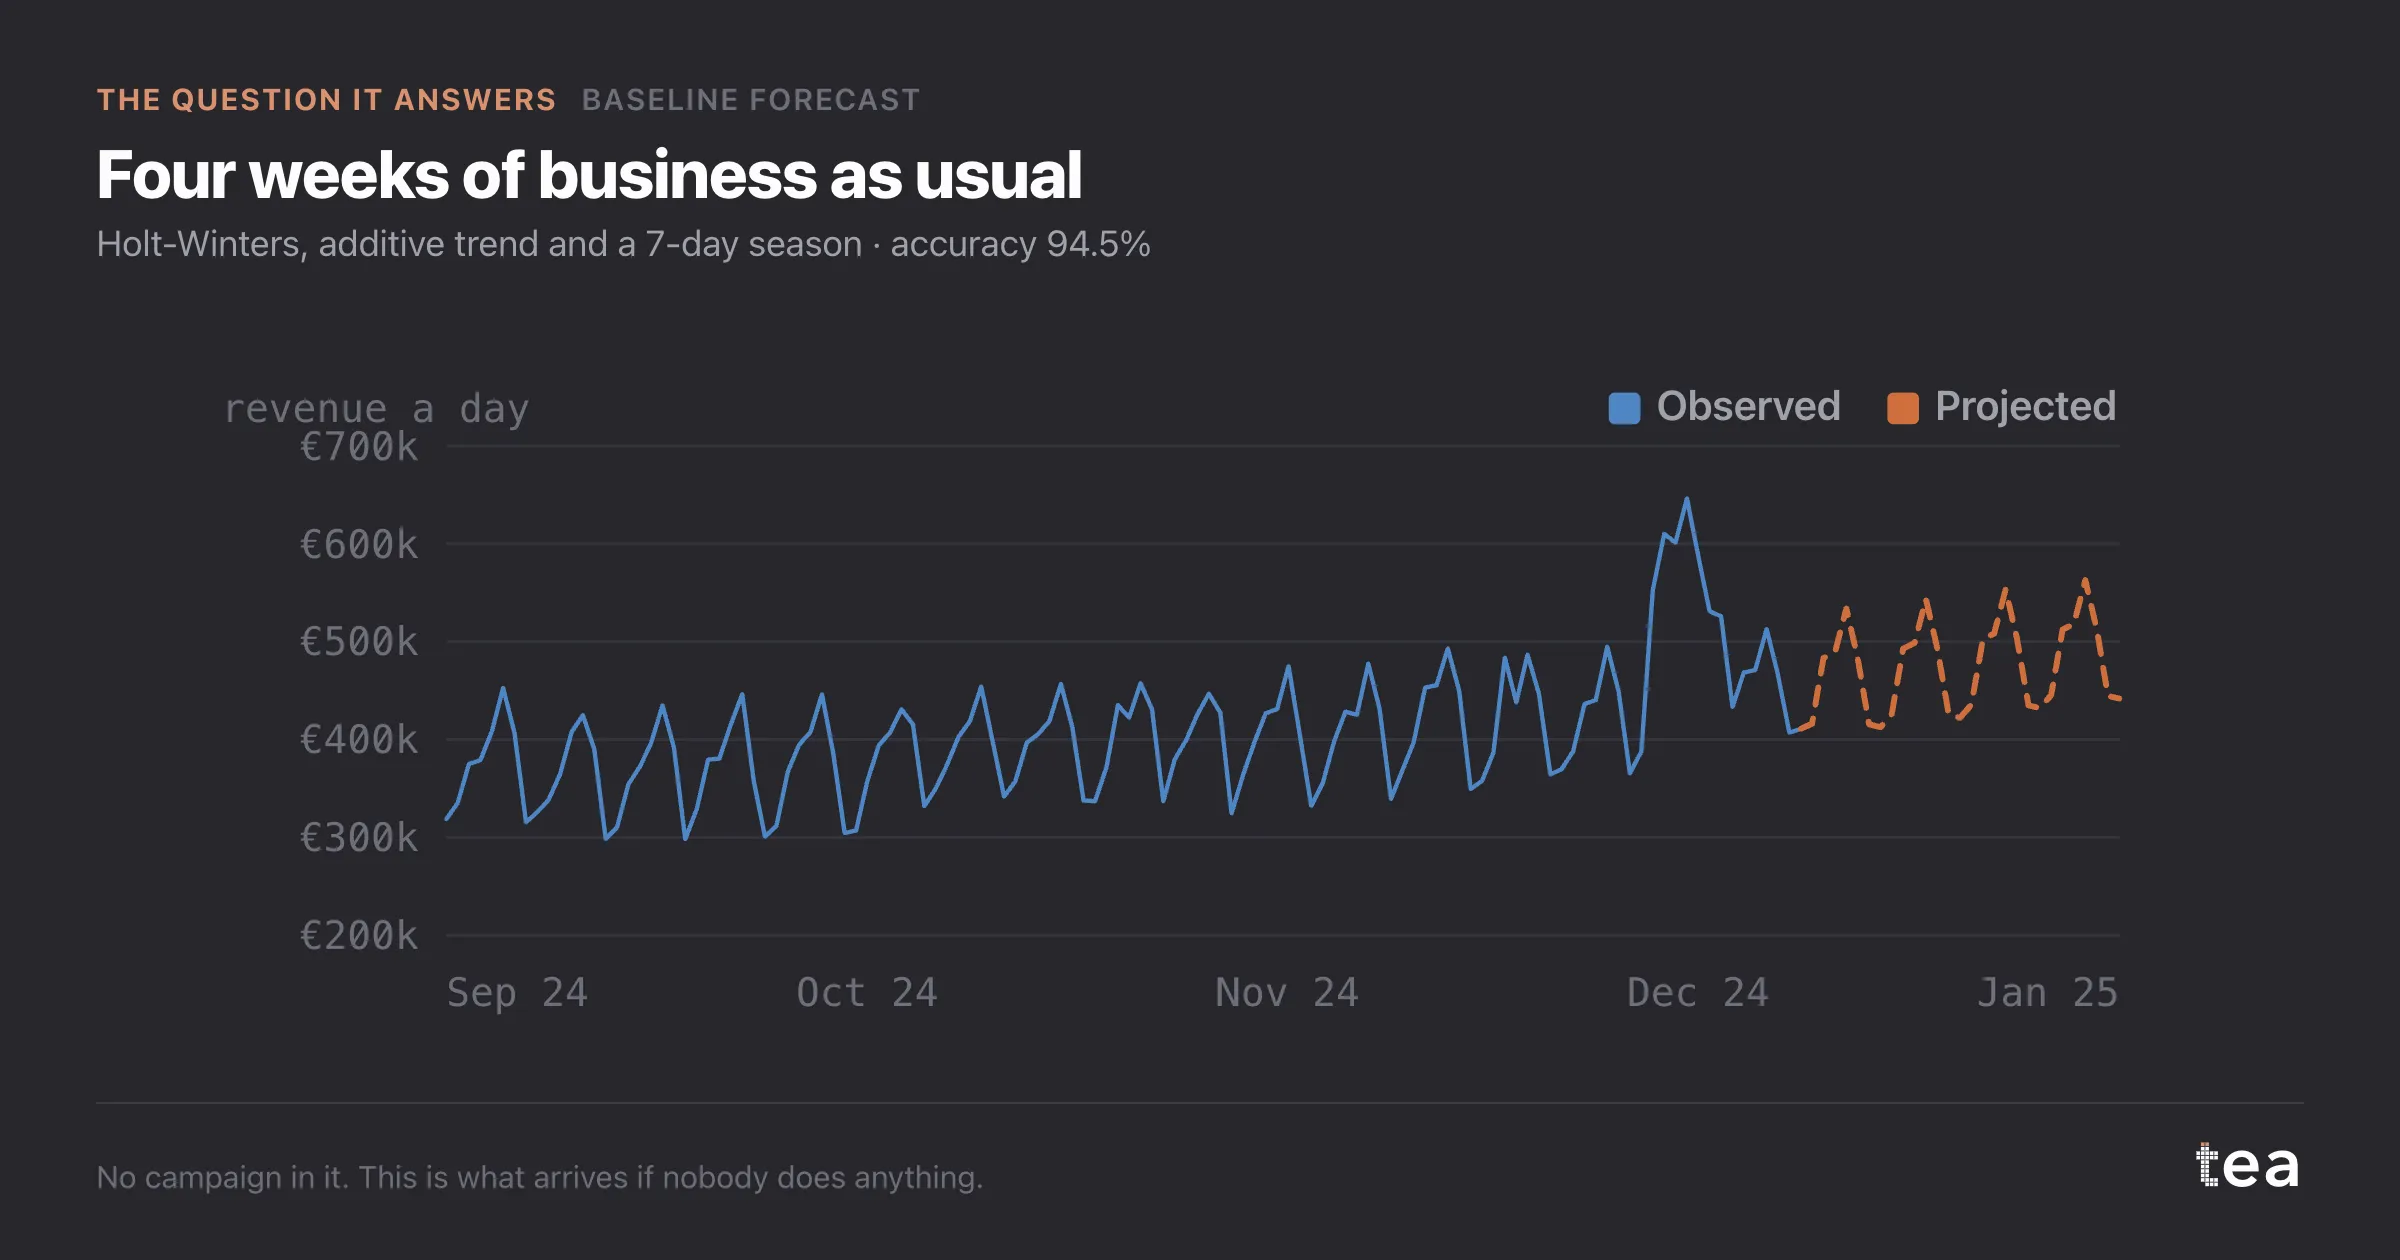
Notice the shape as well as the total. Week three is the odd one: the projection sits below the week just gone, because that week is carrying something the calendar says is not repeating. If you were planning the flight, that is the week to be careful with, and it is invisible in a monthly total.
The discipline underneath is simple to state and rare to see. Forecast the business without the plan. Put the plan on top. Measure the gap. Everything else in marketing measurement is a refinement of those three steps.
The cost of skipping it is specific. It is not that you get the wrong number, it is that you get a number nobody can argue with, because there is nothing to compare it to. That is how a good campaign and a lucky month become indistinguishable in a deck, and how the same budget gets renewed for the wrong reason for years.
Put the benchmark in the brief. It changes what people promise.
One caution on reading the bars. The projection carries the model error with it, and on this series that is about five and a half percent on a typical day. A gap of 1.4% over four weeks is a real expectation, not a guarantee, and the right way to use it is as the centre of a range rather than as a promise.
There is also a version of this chart that quietly ends arguments. When a client asks why the plan is not bigger, the honest answer is often that the baseline is already doing the work, and the incremental euro has to fight it. That is a much better conversation than defending a number, and it starts from the same four bars.
The chart is the actual output of Baseline Forecast in TEA, run on a sample file anyone can download.
tea, the product
Your file, this question
Fifteen analyses on a CSV of weekly data, with the intervals and the diagnostics shown, and a plain sentence when the data cannot answer. Free while in beta, by invitation.
Request a place in the beta→tea, the product
Fifteen econometric analyses on your own CSV: Baseline Forecast, saturation curves, elasticities, budget allocation. Intervals and diagnostics shown, and a plain sentence when the file cannot answer.
Free while in beta, by invitation.
Request a place in the beta →Liked this? Run it on your own data.
tea runs Baseline Forecast and fourteen other analyses on any weekly CSV, in minutes. Free while in beta, by invitation.