ea

Analyses/Planning Path/Baseline Forecast

Next year, with nothing new in it.

Baseline Forecast projects a series forward as if nothing new happens: no campaign, no price move, no launch. It is the line a plan has to beat, written down before anyone argues about the plan.

Answers If nothing changes, where are we headed? Needs A date and one KPI, ideally two full seasons Hands back A 12-period projection, accuracy, MAPE, lift

Next year with nothing new in it, against the target

monthly revenue, €
  • Observed
  • Baseline, business as usual
  • Target, FY26 plus 8%
FY27 with nothing new€49.4Magainst €48.0M in FY26
Already in the trajectory3.0 pointsof the 8 in the target
Left for the plan to earn€2.4M5 points, not 8

A homeware retailer in Germany and Austria, from the first example below. A composite case: your file draws its own baseline, with its own season.

01

What it is for

A target written as “last year plus X” quietly assumes the business would stand still if left alone. Most businesses do not. The baseline is what the business does on its own, and everything a plan claims is the distance above it.

Splitting a target in two

Growth the business was already on and growth the plan has to earn are two numbers pretending to be one. The baseline writes down the first, so the second can be argued about honestly.

A benchmark for every campaign

A campaign that lifts revenue 6% in weeks the baseline was already rising 3% bought three points, not six. Without the line, the calendar takes credit, or blame, for the work.

A projection for the board

“Where would we land without any new initiative?” is a question boards ask, and it deserves a curve and a number rather than a feeling.

02

How to read it

Four numbers and the projection. The block below is the grocery sample anyone can download, 1,083 days of store revenue, with a weekly rhythm and Christmas at the end. Read the numbers in this order.

Store revenue, € a day
Model Accuracy 94.5%1 MAPE (Error Rate) 5.5%2 Avg Change / Period -46.523 Projected Lift 20.0%4

Expected Momentum Projection

Residuals

  1. The accuracy. One hundred minus the average percentage error on the history the model was fitted on. 94.5% is a good fit, and only a fit: it is measured on days the model has already seen.
  2. The error, MAPE. The same number the other way round: on a typical day the model is out by 5.5%. It is the size of the ruler. A campaign lift smaller than that, for a single week, cannot be told from the model’s own noise.
  3. The average change. The average move from one period to the next across the whole history, in the unit of your KPI: here a fall of €46.52 a day. It describes the past. The projection carries its own trend, re-estimated on the recent periods.
  4. The projected lift. The last projected period against the last observed one. Here that is 12 January against 31 December, two different days of the week. On a file with a weekly rhythm that alone can move it by a fifth, and it reads 20.0%. On a seasonal file, compare like periods before quoting it.

03

Where it sits in the analysis

Baseline Forecast opens the Planning Path, the path for “what does next year look like if we do nothing”. It goes first because a plan can only be judged against the year it replaces, and that year has to be written down before the plan exists.

What you carry into the next step is the business-as-usual projection. Time Series then estimates the shape this model assumes, and says how far ahead it is still safe to look.

If the question is whether a slope is real rather than where it leads, Trend Analysis tests it directly.

Planning Path

  1. Baseline Forecast this page

    The trajectory with no intervention in it, which is the only honest baseline for a plan.

    Carries forward: the business-as-usual projection

  2. Time Series (ARIMA)

    Auto-ARIMA picks the specification and argues both sides of the choice, then forecasts with intervals.

  3. Seasonality & Event Impact

    The calendar and the one-off events, so next March is not planned on last March by accident.

  4. Scenario Simulation

    Twenty per cent less media, a price rise, a delayed launch. The plan, under each of them.

04

Where it usually misleads

Holt-Winters is an honest machine: it carries forward whatever the history holds. The trouble is what the history holds, and how the projection gets read once it is on a slide.

A one-off shock learnt as a trend

A customer lost, a store closed, a factory stopped. Exponential smoothing cannot tell “a customer left” from “demand is eroding”, so part of the step goes into the trend, and the trend is projected forward. Second example below.

The model reads one column and nothing else, so the repair happens in the file: rebuild the history like for like before you upload it, then run the baseline on that.

Campaigns learnt as season

Fit a baseline on years full of the same pushes, and the model learns them as the calendar. From then on every campaign is measured against your best month, and looks like it did nothing.

Fit on the quietest stretch you have, or measure the pushes as events with Seasonality & Event Impact before you trust the baseline.

A season seen only once

One December is not a pattern. A seasonal shape learnt from a single year projects that year’s accidents as if they were the calendar, and two years are only just enough.

The seasonal term is used only when the history covers the cycle at least twice, and the insight names the period it used. Below that, the projection carries a trend and no season.

Accuracy measured on the past it learnt

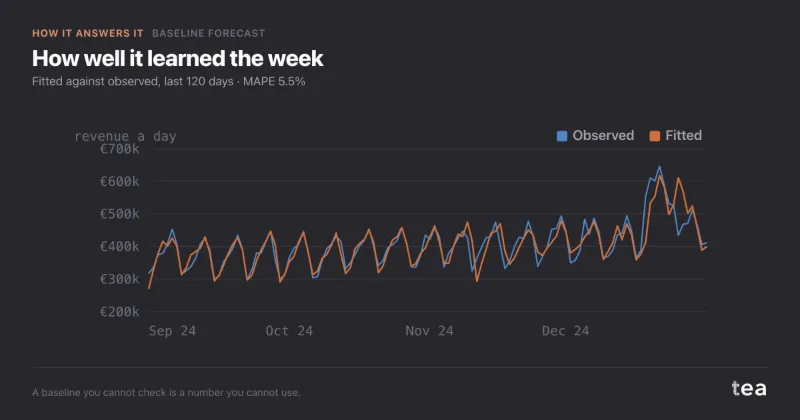
The accuracy beside the projection is how well the model fits the history it was fitted on. It says little about the next twelve periods, and a model tuned until it fits perfectly has usually swallowed the effects you meant to measure.

Hold back the last quarter, run the baseline on the rest and compare it with what happened, as the first example below did on 13 weeks.

A lift between two unlike periods

Projected lift compares one point with another. On a series with a season, the two points can sit on different days, weeks or months of the cycle, and the percentage says more about the calendar than about the business.

Its tooltip says what it compares, and that it assumes nothing is done. On a seasonal file, read the projection across a whole cycle rather than its last point.

A benchmark read as a forecast

The baseline is what happens if nothing new happens, which is a different and more useful thing for a plan than a prediction. Quoted as a forecast, it gets blamed for the campaign it was meant to measure.

tea draws no interval around this projection. When stock or budgets need a range, run Time Series, which forecasts with a 95% band.

05

Two examples

One file where the baseline moved a budget by three points, one where the past was not a baseline at all. Both are useful results.

Helps

Three of the eight points were already coming

A homeware retailer with 22 stores in Germany and Austria closed FY26 at €48.0M, after growth of 3.8% and 3.4% with no new store and no new campaign. The budget meeting set FY27 at plus 8%, and the head of planning asked how much of it would arrive if nothing changed.

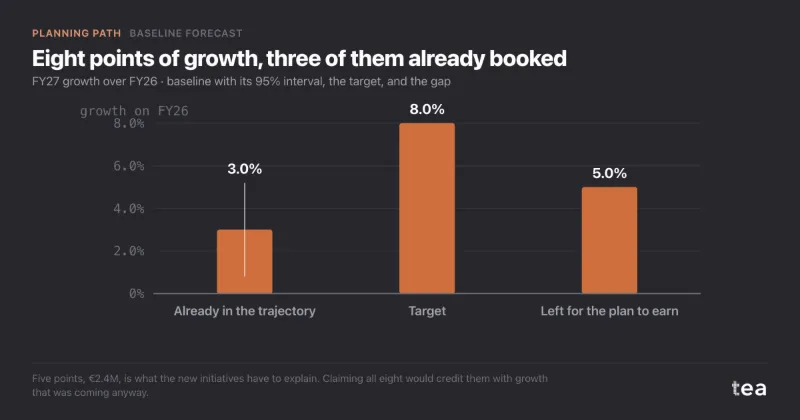
On 156 weeks the baseline came out at €49.4M, up 3.0%. Held back, the last 13 weeks had been missed by 4.1% on average, with no bias. The new initiatives now had to explain 5 points, €2.4M, instead of 8: the media increase came down from 20% to 12%, about €310k went back into the pot, and the commercial team’s bonus was rewritten against the baseline.

Read the full case

Eight points of growth, three already booked

FY27 growth over FY26

Five points, €2.4M, is what the new initiatives have to explain. Claiming all eight would credit them with growth that was coming anyway.
Does not help

A lost customer learnt as a decline

A fresh-pasta producer in Emilia lost a discounter worth about 18% of its volume in December 2025. The file held 104 weekly rows of cases shipped and no column saying which customer they went to, with only 38 weeks after the loss.

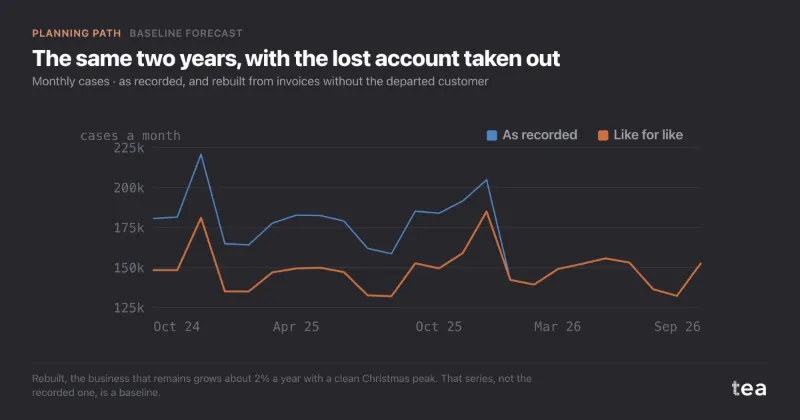
Fitted across the break, the model read part of the step as a trend and projected next year at 1.57M cases, about 10% below the 1.75M the business was already running at. Its Christmas was the departed customer’s. Rebuilt like for like from the invoices, the same two years grow about 2% a year, and the baseline came out at 1.84M cases.

Read the full case

The model learnt a decline that was one customer

cases a month
  • As recorded
  • Like for like, lost account removed
  • Baseline on the file as is

The fix was not in the model. It was in the file.

06

What the charts add to the numbers

A projected total is one number, and it hides the shape that produced it. The charts show whether the model could draw the past before anyone trusts what it draws for the future.

Expected Momentum Projection

actual, benchmark, forecasted path

Reads as: does the benchmark follow the weekly rhythm, and where does it lose it? Grey is what happened, the solid line is the model on the same days, the dashed part is the next twelve. On the grocery sample it keeps the week and reaches the Christmas peak a day late: a seven-day season cannot see a once-a-year week coming.

Residuals

what the benchmark missed, day by day

Reads as: is the error the same size every day, or does it hide something? Here it stays mostly within €50k, with a few misses near €100k, until the last fortnight, when it swings from €141k above to €178k below. The days the model misses are usually the days something happened.

Seasonal Pattern: Actual vs Trend

the history against its seven-day average
  • Actual
  • Trend, seven-day moving average

Reads as: how much of the movement is rhythm and how much is level. The average smooths the week away and leaves what the business is doing underneath: rising gently through the autumn, then a step up for Christmas. When the average itself wanders, the baseline’s trend term is being asked to follow it, and the projection will carry that wander forward.

tea, the product

Write down the year your plan has to beat

A CSV with a date and one number. The projection, its accuracy and its residuals, in seconds, and the season it used named in plain words. Free while in beta, by invitation.

Request a place in the beta

tea, the product

Fifteen econometric analyses on your own CSV: Baseline Forecast, saturation curves, elasticities, budget allocation. The diagnostics shown, and a plain sentence when the file cannot answer.

Free while in beta, by invitation.

Request a place in the beta →

Now run it on your own data.

tea runs Baseline Forecast and fourteen other analyses on any weekly CSV, in minutes. Free while in beta, by invitation.

Join the beta