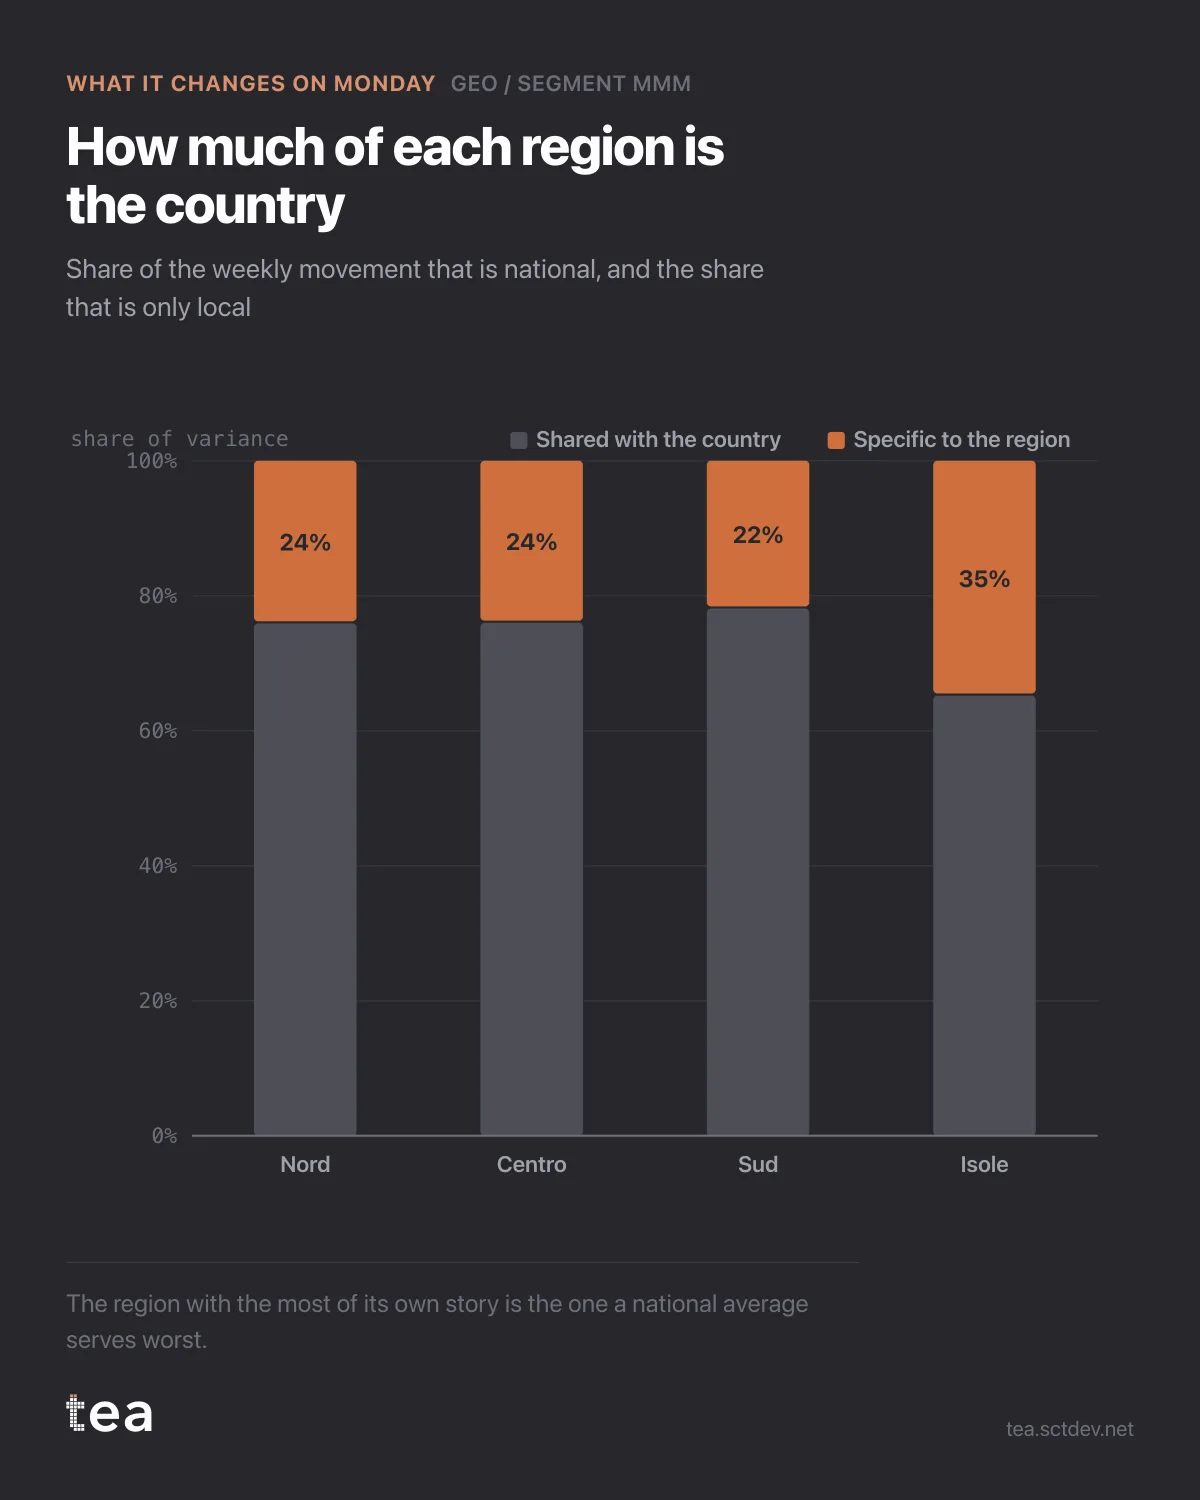
How much of each region is the country, and how much is only itself? Four bars, and it decides how you organise the plan.
Across this business, 72.8% of the weekly movement is shared nationally and 27.2% is local. Region by region the local share runs 24%, 24%, 22%, and then 35% for the islands.
Three regions move with the country. One has a third of its own story.
That single outlier is worth more attention than the three that agree, because it is where a national plan does the most damage. A campaign calendar built on national seasonality, national promotions and national flighting will fit three of these regions well and fight the fourth one every week.
What to do with the numbers, in order:
Set the default nationally. With roughly three quarters of the movement shared, the national plan is the right starting point, and building four independent regional plans would be a large amount of work to reproduce the same answer three times.
Carve out the exception explicitly. The island region needs its own calendar or its own budget line, and now there is a number behind that request rather than a regional sales manager's conviction.
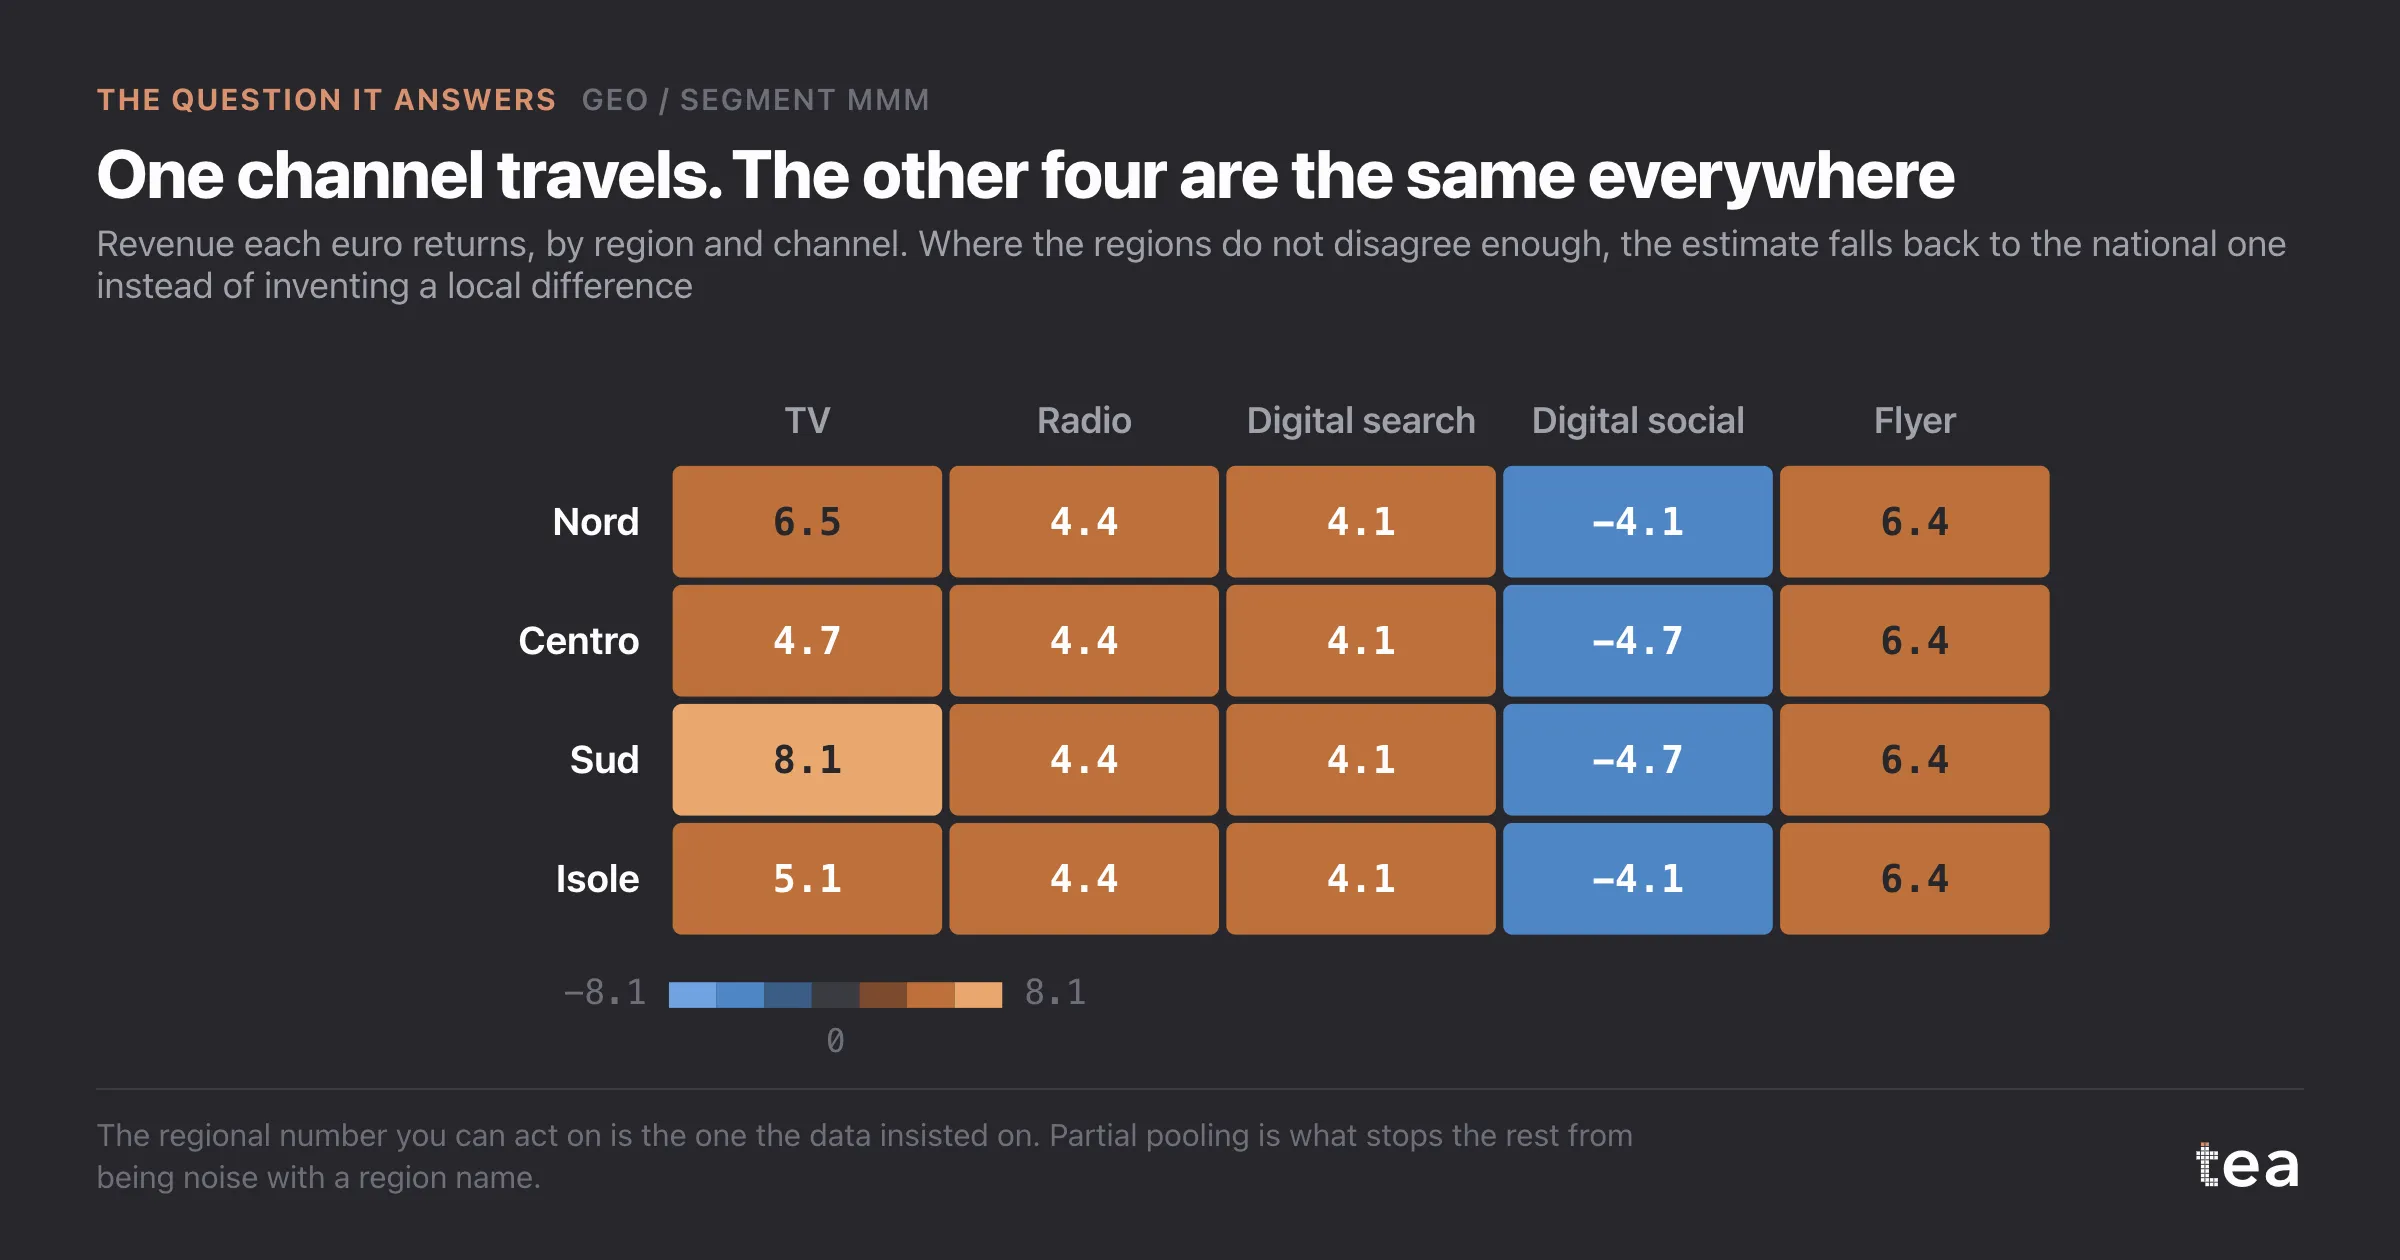
Then check whether the exception is real or structural. A high local share can mean a genuinely different market, or it can mean that region is small and noisy. Here it is both: the smallest region by revenue, and the weakest fit at R² 0.42. So the honest move is to treat it as a candidate for separate planning and to collect more before committing budget to the difference.
The general principle is worth more than this file. Aggregation is not free and disaggregation is not free either. One of them hides differences that matter, the other invents differences that do not exist. The variance split tells you, per segment, which mistake you are closer to making.
One caution on reading the split. Shared and specific are shares of variance, not shares of revenue. A region that moves with the country can still be the largest part of the business, and one that moves on its own can be a rounding error in the total.
Put the two side by side before anyone reorganises a plan around this chart: local share for how differently a region behaves, revenue for how much that difference is worth. The region that deserves its own plan is the one where both are large.
Here the two point in opposite directions, and that is the honest, slightly unsatisfying answer this analysis produces more often than not.
The chart is the actual output of Geo / Segment MMM in TEA, run on a sample file anyone can download.
tea, the product
Your file, this question
Fifteen analyses on a CSV of weekly data, with the intervals and the diagnostics shown, and a plain sentence when the data cannot answer. Free while in beta, by invitation.
Request a place in the beta→tea, the product
Fifteen econometric analyses on your own CSV: Geo / Segment MMM, saturation curves, elasticities, budget allocation. Intervals and diagnostics shown, and a plain sentence when the file cannot answer.
Free while in beta, by invitation.
Request a place in the beta →Liked this? Run it on your own data.
tea runs Geo / Segment MMM and fourteen other analyses on any weekly CSV, in minutes. Free while in beta, by invitation.